
Customer support metrics are simply data points that help you measure how well your support team is doing.Customer support metrics are simply data points that help you measure how well your support team is doing. Think of them as a way to turn fuzzy goals like "keeping customers happy" into trackable, actionable numbers. They give you a clear window into everything from how productive your agents are to how satisfied your customers really feel.
Why Customer Support Metrics Are Your Business Compass
Trying to run a business without data is like sailing a ship without a compass. You’re moving, but are you headed for treasure or a storm? Customer support metrics are your navigational tools, giving you the hard data you need to steer your company in the right direction and avoid costly missteps.
These numbers aren't just for spreadsheets; they're the vital signs of your customer relationships. They tell you a story, showing you where you’re knocking it out of the park and, more importantly, where you have urgent problems to fix. In today's market, ignoring them isn't really an option if you want to stick around and grow.
The Financial Impact of Great Support
The link between the quality of your support and your bottom line is crystal clear. Bad customer service isn’t just a minor annoyance—it's a huge financial liability. It's estimated to cost U.S. companies around $75 billion a year. That’s a staggering number that shows just how real the consequences of poor support are.
And it's not just about losing customers. The cost to replace a single customer service agent can be as high as $10,000, which tells you that the biggest challenges are often about people, not technology. You can dig into more eye-opening numbers in this detailed report on customer service statistics.
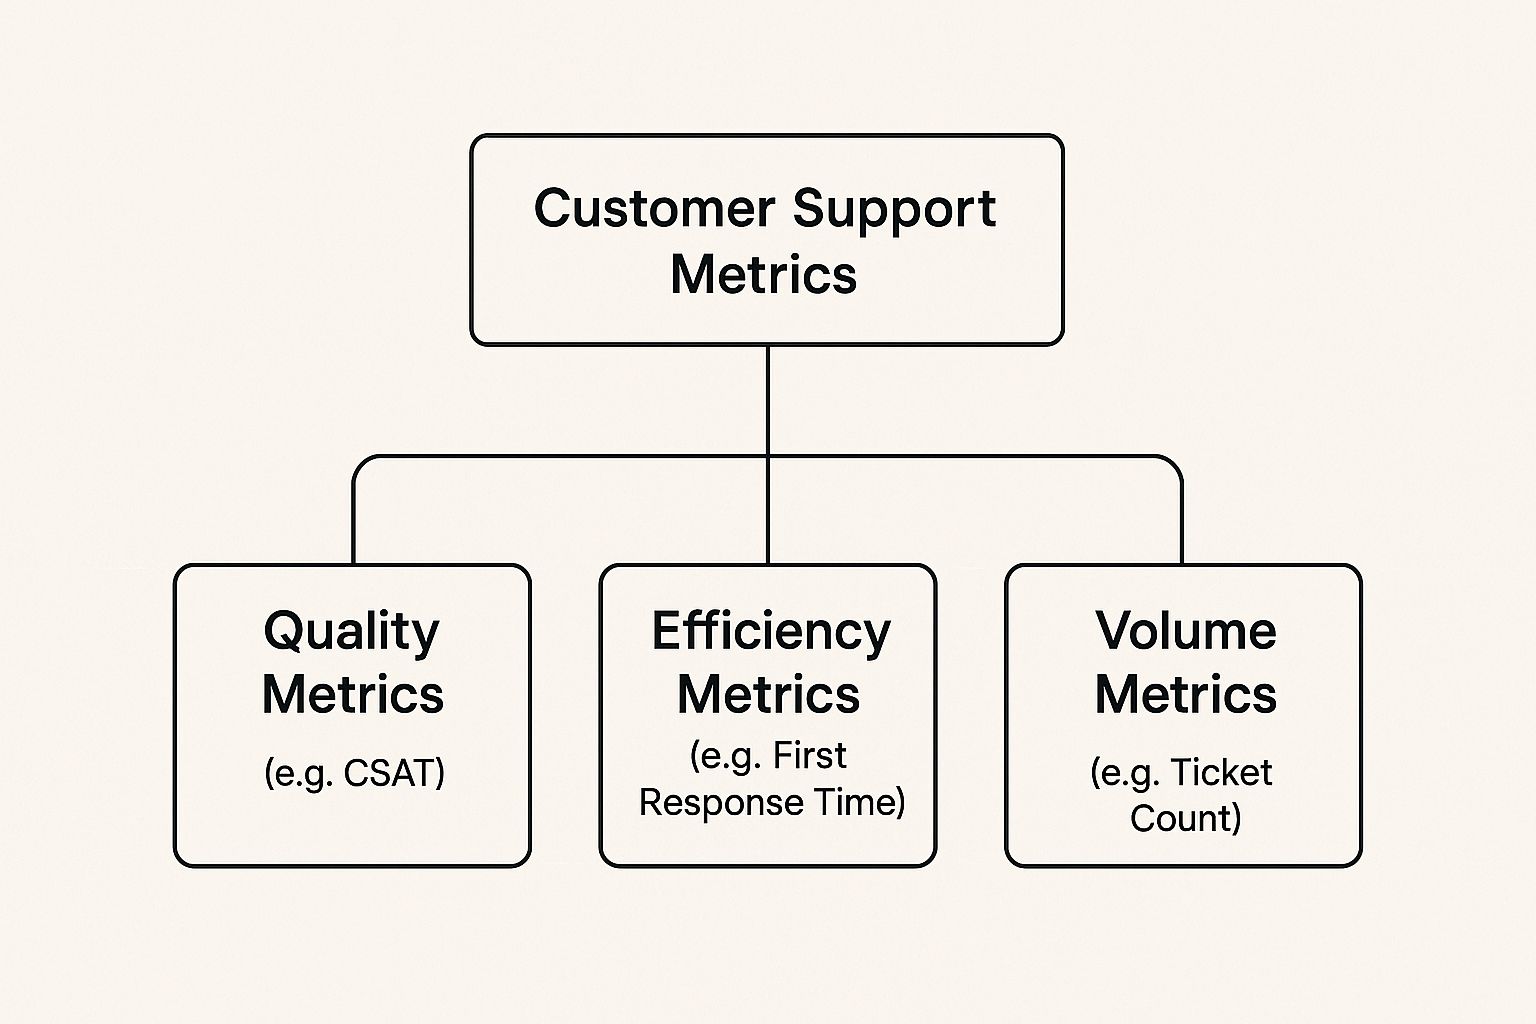
As you can see, metrics fall into a few key categories. By tracking a mix of them, you get a well-rounded picture of your team's performance, covering everything from quality and efficiency to the sheer volume of work they handle.
To make sense of it all, it helps to group these metrics into four main areas.
The Four Pillars of Customer Support Metrics
This table breaks down the core categories of metrics. Each pillar gives you a different view of your support operations, and together, they provide a complete picture.
| Metric Category | What It Measures | Example Metrics |
|---|---|---|
| Operational Performance | The overall efficiency and productivity of your support team. | First Response Time (FRT), Average Handle Time (AHT) |
| Customer Experience | How customers feel about their interactions with your support team. | Customer Satisfaction (CSAT), Net Promoter Score (NPS) |
| Team Performance | The individual effectiveness and workload of your support agents. | Tickets Solved Per Agent, Agent Occupancy |
| Business Impact | The direct effect of your support efforts on the company's bottom line and growth. | Customer Churn Rate, Customer Lifetime Value (CLV) |
Looking at metrics through this framework helps ensure you're not just focusing on one area, like speed, at the expense of another, like customer happiness.
From Cost Center to Growth Engine
For a long time, businesses saw customer support as a "cost center"—a department that spent money but didn't make any. That's an old-school way of thinking that holds companies back. Once you start tracking the right metrics, you can completely change that story.
By focusing on data, you can demonstrate how excellent service directly influences customer loyalty, reduces expensive churn, and even drives new revenue through positive word-of-mouth.
This shift starts with knowing what to measure and why it matters. When you use metrics to guide your strategy, your support team stops being just a reactive problem-solving unit. They become a proactive engine for growth, spotting product flaws, improving the customer experience, and building relationships that turn casual buyers into lifelong fans.
Keeping an Eye on Your Team's Efficiency and Performance

While the customer’s experience is what it's all about, you can't improve it without first understanding what’s happening behind the scenes. Digging into your team’s efficiency and performance metrics is a bit like a mechanic looking under the hood of a car; it shows you how well the engine is actually running. These numbers tell you how quickly your team is getting back to people, how many conversations they’re juggling, and how long it takes to truly solve a customer's problem.
But there's a delicate balance here. If you only chase speed, you risk burning out your team and delivering sloppy, incomplete answers. The real goal isn't to micromanage with a stopwatch. It's to build a supportive, data-informed culture where everyone has the insights they need to do their best work.
First Response Time (FRT): Your Digital Handshake
First Response Time (FRT) is simply the average time it takes for a real person on your team to send that first reply to a customer. It’s not about solving the entire problem in one go. Think of it as the customer service equivalent of a friendly greeting when someone walks into a shop. It’s about making them feel seen.
A fast, personal response immediately tells your customer, "We hear you, and we're on it." That simple acknowledgment can do wonders to ease their frustration and build a little goodwill right from the start. As a benchmark, 34% of support teams get back to customers within an hour, which is a great target to work towards.
To figure out your FRT, you just average the time between a ticket being created and that first human reply going out. Just remember, those automated "we got your email" confirmations don't count here!
Ticket Volume Trends: What's the Story Behind the Numbers?
Ticket Volume is exactly what it sounds like: the total number of support requests your team gets over a certain period—be it a day, week, or month. It’s one of the most basic operational metrics, but it’s foundational. It shows you exactly what your team's workload looks like and can often point to bigger things happening in the business.
A sudden spike in tickets isn't automatically a bad thing. It could be the happy result of a new product launch or just good old-fashioned growth. But if that spike is full of the same repetitive questions or bug reports, it's a clear signal that something needs fixing.
The key is to interpret what your ticket volume is telling you. A flood of "how-to" questions might mean your onboarding guides need a refresh. A surge in bug reports right after a software update? That's an immediate red flag for your engineering team.
By watching these trends, you can staff your team smarter, anticipate busy seasons, and pinpoint where better documentation or a product tweak could lighten the support load for everyone.
Average Handle Time (AHT): More Than Just a Stopwatch
Average Handle Time (AHT) tracks the total active time an agent spends working on a single customer issue, from the moment they open it to the final resolution. This includes talking to the customer, doing research, writing internal notes, and any other follow-up needed to get the job done.
AHT is a great metric for efficiency, but it comes with a huge warning label: you have to look at it in context. If you push your agents to drive down their AHT at all costs, they’ll start rushing through conversations and offering flimsy, quick-fix answers. That just leads to frustrated customers coming back again, which creates even more work and tanks your satisfaction scores.
Here's how to use AHT the right way:
- Pair it with quality checks: Never look at AHT in a vacuum. Always review it alongside your Customer Satisfaction (CSAT) scores. A low AHT combined with a high CSAT is the sweet spot.
- Segment by issue type: A tricky technical problem will naturally take longer to solve than a simple billing question. Breaking down AHT by category helps you set realistic expectations.
- Use it as a coaching tool: A high AHT isn't always bad; it could mean your team is skillfully handling tougher issues. It can also point to agents who might need more training or better resources, like an easy-to-search knowledge base.
When you focus on a healthy balance instead of just raw speed, you empower your team to provide thorough, high-quality support that actually solves problems. For a deeper dive into these and other essential KPIs, our guide on the top customer support metrics that matter offers more great insights.
Measuring the Customer Experience

So far, we've looked at metrics like response and handle time, which are great for seeing how efficiently your team is working. But they miss the most important piece of the puzzle: how your customers actually feel.
To get the full picture, you have to measure the customer experience directly. This is where we move beyond internal report cards and start gauging external happiness and loyalty. We stop asking "how fast?" and "how many?" and start asking the one question that truly matters: "Are we making our customers happy?"
By collecting direct feedback, you can turn those fuzzy feelings into hard data. This data is pure gold—it helps you refine your strategy, improve your service, and build much stronger customer relationships.
Customer Satisfaction Score (CSAT): The Instant Snapshot
If you want a quick pulse check on a specific interaction, the Customer Satisfaction Score (CSAT) is your go-to metric. Think of it as an immediate thumbs-up or thumbs-down right after you've closed a support ticket.
It's usually measured with a simple, direct question like:
"How satisfied were you with the support you received today?"
Customers then rate their experience on a simple scale, maybe 1-5 stars or from "Very Unsatisfied" to "Very Satisfied." To get your score, you treat the top two ratings (like a 4 or 5) as "positive."
The formula is straightforward:
(Number of positive responses / Total number of responses) x 100 = CSAT %
The real power of CSAT is its immediacy. When a customer gives a low score, you know exactly which conversation went wrong. This lets you follow up right away to fix the problem and figure out the root cause before it snowballs.
Net Promoter Score (NPS): The Long-Term Health Check
While CSAT gives you a snapshot, Net Promoter Score (NPS) provides the panoramic view of your entire customer relationship. It’s not about one ticket; it’s about long-term loyalty and how people perceive your brand as a whole.
NPS boils down to one powerful question:
"On a scale of 0 to 10, how likely are you to recommend our company to a friend or colleague?"
Based on their answers, customers fall into three distinct camps:
- Promoters (9-10): These are your champions. They love what you do and will actively tell others about you.
- Passives (7-8): They're satisfied, but not wowed. They're happy enough for now but could easily be wooed by a competitor.
- Detractors (0-6): These customers are unhappy. They're at risk of leaving and might even share negative reviews.
To calculate your NPS, you just subtract the percentage of Detractors from the percentage of Promoters. The final score, which can range from -100 to +100, is a potent indicator of your overall customer loyalty.
An NPS survey, often sent quarterly or biannually, gives you a high-level view of customer sentiment. A declining score can be an early warning sign that something is amiss with your product or overall service experience, even if individual CSAT scores seem fine.
Customer Effort Score (CES): Measuring How Easy You Are to Do Business With
Customer Effort Score (CES) is built on a simple yet profound truth: people stick with companies that are easy to work with. CES measures exactly that—how much work a customer had to put in to get their problem solved.
The survey question gets right to the point:
"To what extent do you agree or disagree with the following statement: The company made it easy for me to handle my issue."
Customers respond on a scale from "Strongly Disagree" to "Strongly Agree." Making things easy for customers is a massive driver of loyalty. In fact, research shows that a staggering 94% of customers who have a low-effort experience will buy from that same company again.
This metric is fantastic for finding friction in your support process. A bad CES score might point to a confusing knowledge base, a convoluted contact form, or agents who keep asking for the same information. By reducing that effort, you make your customers happier and keep them coming back.
Don't underestimate the importance of these metrics. Customer loyalty is incredibly fragile; 73% of consumers will jump ship to a competitor after just a few bad experiences. On the flip side, three out of four customers will spend more with companies that deliver great service. As you can see from this comprehensive report from Zendesk, these trends make a clear case for why investing in customer support is fundamental to business success.
Connecting Support Metrics to Business Outcomes
It’s one thing to know if your team is efficient or if your customers are happy. It's another thing entirely to connect those dots directly to business growth. This is where customer support metrics go from being simple report cards to powerful tools for proving your team's value.
When you can walk into a leadership meeting and show how great support impacts the bottom line, you change the entire conversation. Suddenly, support isn’t just a cost center; it's a strategic driver of revenue and retention. The trick is to start speaking their language: dollars and cents.
From Service Metric to Financial Impact
Metrics like First Contact Resolution (FCR), Cost Per Resolution, and Customer Churn Rate are your best friends here. Why? Because they have a clear, undeniable financial impact. They build a solid bridge between your team's day-to-day work and the company's financial health.
Think about it. Improving your FCR isn't just about making one customer happy, one time. It's about preventing that customer from having to call or email again. That directly lowers your operating costs and frees up your agents to tackle more complex problems.
Every single time an issue gets solved on the first try, you've erased the cost of follow-up emails, extra phone calls, and more agent hours. When you multiply that by thousands of customer interactions, the savings really start to stack up.
When you track and present these kinds of business-focused metrics, you’re not just asking for more budget for training or tools. You’re building a business case and demonstrating a clear return on that investment. This isn't just a niche strategy, either. It’s becoming the standard.
The global market for customer service software was recently valued at around $14.9 billion. It’s expected to explode to $68.19 billion by 2031. This tells you everything you need to know about how seriously companies are taking customer experience, with over 50% calling it a top strategic priority. You can dig into more of these trends and what's behind them in this detailed industry overview.
Cost Per Resolution and Operational Efficiency
Cost Per Resolution is a fantastic metric for getting a real-world look at your team's efficiency. It calculates the total price tag for solving a single support ticket. You just bundle up all the related expenses—agent salaries, software fees, overhead—and divide that by the number of tickets you've closed.
A high Cost Per Resolution is often a red flag for hidden problems. Maybe your agents don't have the right tools, or their training has gaps. This forces them to spend more time on each ticket, which drives up the cost. By watching this metric, you can spot where your workflows need help. For example, using a tool like Screendesk for video support can slash this cost by letting agents show—not just tell—customers how to fix complex issues, cutting down on the endless back-and-forth that bloats resolution time.
Linking Churn Rate to Support Quality
Customer Churn Rate is the metric that keeps executives up at night. It measures the percentage of customers who walk away from your business over a certain period. It's a critical pulse-check on the long-term health of the company, and your support team is on the front lines, defending against it every day.
A bad support experience is a fast track to churn. It's that simple. By putting your churn data next to support metrics like CSAT and FCR, you can draw a straight line between service quality and customer loyalty. You might discover that customers who give you a low CSAT score are three times more likely to cancel their subscription next quarter. When you present that kind of data, the value of great support becomes impossible to ignore.
Understanding these connections is the first step to building a truly indispensable support department. To go deeper, take a look at our guide covering 10 key customer support indicators of success. Once you master these business-focused metrics, you'll prove that your team doesn't just save customers—it actively creates value for the entire company.
Building a Data-Driven Support Culture

Knowing your customer support metrics is one thing. Actually getting your team to care about them? That’s a whole different ball game. The most beautiful data in the world is useless if it’s just collecting dust in a spreadsheet or, worse, making your team anxious. The real goal is to create a culture where metrics are seen as a friendly guide, not a final judgment. It’s about turning raw numbers into something that motivates everyone to win together.
This all starts by changing the conversation from "Who's to blame?" to "How can we all get better?" Data should never be a weapon for performance reviews. It should be the starting point for helpful chats that show agents where they can grow and, just as importantly, celebrate what they're already knocking out of the park. When your team trusts that the numbers are there to help, they'll jump on board to improve performance.
Setting Achievable and Inspiring Goals
Great goals aren't just plucked from thin air. They need to be rooted in reality, mixing industry standards with what makes sense for your business. Simply chasing the lowest possible Average Handle Time (AHT) or the highest ticket count is a fast track to burnout and sloppy service. A much smarter approach is setting goals that stretch your team without breaking them.
For example, instead of a vague goal to "lower AHT," try something specific, like aiming to reduce it for simple, repetitive questions. This focuses your team's energy where it can make a real difference, without rushing them through the tough, complex problems that need more time.
The best goals are built together. Pull your team into the goal-setting process. When agents have a say in their own targets, they feel a real sense of ownership and are way more motivated to hit them.
And always, always tie the goals to the bigger picture. Explain the why behind the metric. Show your team how nailing First Contact Resolution (FCR) doesn't just make customers happier—it also lightens everyone's workload, making the day less stressful for the whole team.
From Dashboards to Meaningful Conversations
An easy-to-read dashboard is the heart of a data-driven culture. It should tell a clear story at a glance, making performance insights obvious to everyone, not just the managers. Tools like Screendesk are built for this, turning complicated data into simple, visual trends that anyone can understand.
But the dashboard is just the start. The real magic happens when you use that data to spark meaningful one-on-one coaching sessions.
Here’s a simple way to use metrics in coaching:
- Celebrate Wins First: Always kick things off by pointing out what an agent is doing well. "Your CSAT score has been fantastic this month. What do you think is contributing to that success?"
- Explore Opportunities Together: Frame areas for improvement as a shared puzzle to solve. "I noticed our Escalation Rate for billing issues is a bit high. Any thoughts on why that might be happening?"
- Ask, Don't Tell: Help agents find their own answers. Instead of saying, "Your response time is too slow," try asking, "What are some of the biggest roadblocks you run into when trying to respond quickly?"
This approach encourages a growth mindset, turning what could be a dreaded performance review into a productive, forward-looking chat. It’s about empowerment, not enforcement. When your agents see metrics as a tool for their own development, your entire support operation levels up. For more on this, our breakdown of essential customer service metrics offers valuable insights into building a successful, data-informed team.
Turning Your Metrics Into Action with Screendesk
Knowing your customer support metrics is one thing. Actually using them to improve your team's performance is where the magic happens. It’s all about taking that raw data and turning it into something your team can see, understand, and act on. This is precisely where a tool like Screendesk comes in, helping you move from theory to reality.
Think about it. Instead of digging through endless spreadsheets, imagine having a live dashboard with all your key numbers right in front of you. You could see your Customer Satisfaction (CSAT) score tick up after a great interaction, keep an eye on your First Response Time (FRT), and spot a surge in tickets before it becomes a full-blown crisis. This kind of immediate insight helps you shift from putting out fires to strategically preventing them.
Get a Clear Picture of Your Support Health
With Screendesk, these metrics stop being static figures on a weekly report and become a dynamic part of your daily rhythm. The entire platform is built to make your data come alive, so you can instantly connect your team’s efforts to real-world outcomes.
- Real-Time Dashboards: Get a quick, at-a-glance view of what matters most. Are you on track to meet your SLA goals for the day? Is there a sudden spike in tickets that means you need to move people around?
- Automated Reporting: Forget about the soul-crushing task of manually pulling reports. Screendesk can automatically pull together and share performance data, giving managers more time to coach their teams instead of just crunching numbers.
- AI-Powered Insights: Sometimes the most important stories are hidden beneath the surface. AI analysis can spot patterns you might miss, like which specific problems always lead to low CSAT scores or long resolution times, pointing you straight to the root cause.
When data is this easy to understand, it gives managers the power to quickly find process roadblocks, celebrate agents who are doing amazing work, and make smarter decisions based on solid evidence, not just gut feelings.
A Real-World Example: Putting Data to Work
Let's walk through a common scenario. A support manager glances at her Screendesk dashboard and notices that the Average Handle Time (AHT) for tickets about "billing setup" has jumped by 15% in the last two weeks. Looking closer, she sees it’s not just one agent—it's happening across the board.
Instead of just guessing what's wrong, she uses the platform to investigate. She discovers that these tickets also have a lot of back-and-forth messages. By reviewing a few anonymized customer session recordings in Screendesk, she finds the problem: customers are consistently getting tripped up at the exact same step in the payment form.
The solution is suddenly crystal clear. The manager uses Screendesk to record a quick, two-minute tutorial video showing customers exactly how to complete the billing setup. She adds it to their knowledge base and creates a canned response so agents can share it instantly.
The result? Within a week, the AHT for these specific issues drops by 30%, and the CSAT scores for those interactions get a nice little boost. That’s how you take a simple number on a dashboard and turn it into a meaningful improvement for both your team and your customers.
Common Questions About Support Metrics
Even after you get the hang of the key metrics, a few questions tend to come up again and again. Let's walk through some of the most common ones to clear up any confusion so you can put these ideas to work with confidence.
Getting these details right is the difference between simply collecting data and building a strategy that actually moves the needle.
What Is the Single Most Important Customer Support Metric?
Everyone wants to know the "one metric to rule them all," but the honest answer is: it doesn't exist. The most important metric really depends on what you’re trying to achieve right now. Is your main goal to build loyalty, make your team more efficient, or gather feedback to improve your product?
But, if you absolutely had to pick just one, most experts would point to either Customer Satisfaction (CSAT) or First Contact Resolution (FCR).
- CSAT is your direct line to a customer’s feelings. It gives you an immediate pulse on how happy they were with a specific conversation, making it a pure measure of their sentiment in that moment.
- FCR, on the other hand, is a powerful signal of an efficient and effective support process. When you can solve a customer's problem on the first try, they're thrilled. It also saves you a ton of time and money by cutting out needless follow-up conversations.
How Often Should I Review My Support Metrics?
There’s no magic number here. How often you check your metrics should depend on what each metric is telling you. Staring at every number every day is a recipe for analysis paralysis, but waiting too long to review key trends means you'll be too late to react.
A good rule of thumb is to match your review cadence to the metric's function. Operational numbers need daily attention, while strategic ones benefit from a monthly or quarterly perspective.
Here’s a simple schedule you can adapt:
- Daily or Real-Time: Keep an eye on operational stats like Ticket Volume and First Response Time (FRT). This helps you manage the day-to-day workflow and jump on any sudden issues.
- Weekly: Look at team performance metrics like Average Handle Time (AHT). This is great for spotting coaching opportunities and identifying small trends before they become big problems.
- Monthly or Quarterly: Dig into the big-picture numbers like Net Promoter Score (NPS) and Customer Churn Rate. These metrics tell you about the long-term health of your customer relationships and the overall impact on the business.
Ready to stop guessing and start seeing? Screendesk provides real-time dashboards that turn complex data into clear, actionable insights, helping you improve every customer support metric that matters. See how it works at https://screendesk.io.