
Beyond Ticket Counts: What Analytics Really Reveal

This screenshot shows a sample customer support analytics dashboard. See how it visualizes key metrics like resolution time and customer satisfaction? This visual representation helps support teams quickly understand performance trends and find areas to improve.
This deep dive into your data shows more than just the number of tickets; it reveals the "why" behind customer behavior. Imagine a sudden surge in negative customer feedback. While ticket counts might stay the same, this change in sentiment shows a problem developing.
This brings us to why it's important to go beyond just counting tickets. Think of it like a doctor's diagnosis: relying only on a patient's pulse misses critical information.
Similarly, focusing only on the number of support tickets gives you a limited view. This narrow focus can lead to costly mistakes.
Businesses in the United States lose about $75 billion each year because of poor customer service. This huge loss highlights the need for effective customer support analytics. It reveals that many issues come from fundamental service problems, not just a lack of tech investment. Discover more insights about these costly service failures.
Unveiling the Story Behind the Numbers
Effective customer support analytics tells a story about customer interactions, revealing patterns and trends. These patterns offer insights into things like customer satisfaction, agent performance, and how efficient your operations are.
This deeper understanding helps businesses address issues proactively and improve their support strategies. Analyzing response times, resolution times, and customer feedback shows how efficient and effective your support team is.
You can break down this information further by support channel (email, Zendesk Chat, phone), product or service, and even individual agents. For example, looking at the average resolution time for different product lines might show you need more training or resources for a particular product.
This detailed analysis allows businesses to make data-driven decisions. Decisions that improve customer satisfaction and help the business grow. By going beyond simple metrics and understanding the stories within their support data, companies can transform their support operations.
It moves them from simply reacting to problems to proactively building relationships. It’s about understanding the people behind the numbers.
The Metrics That Actually Drive Business Growth
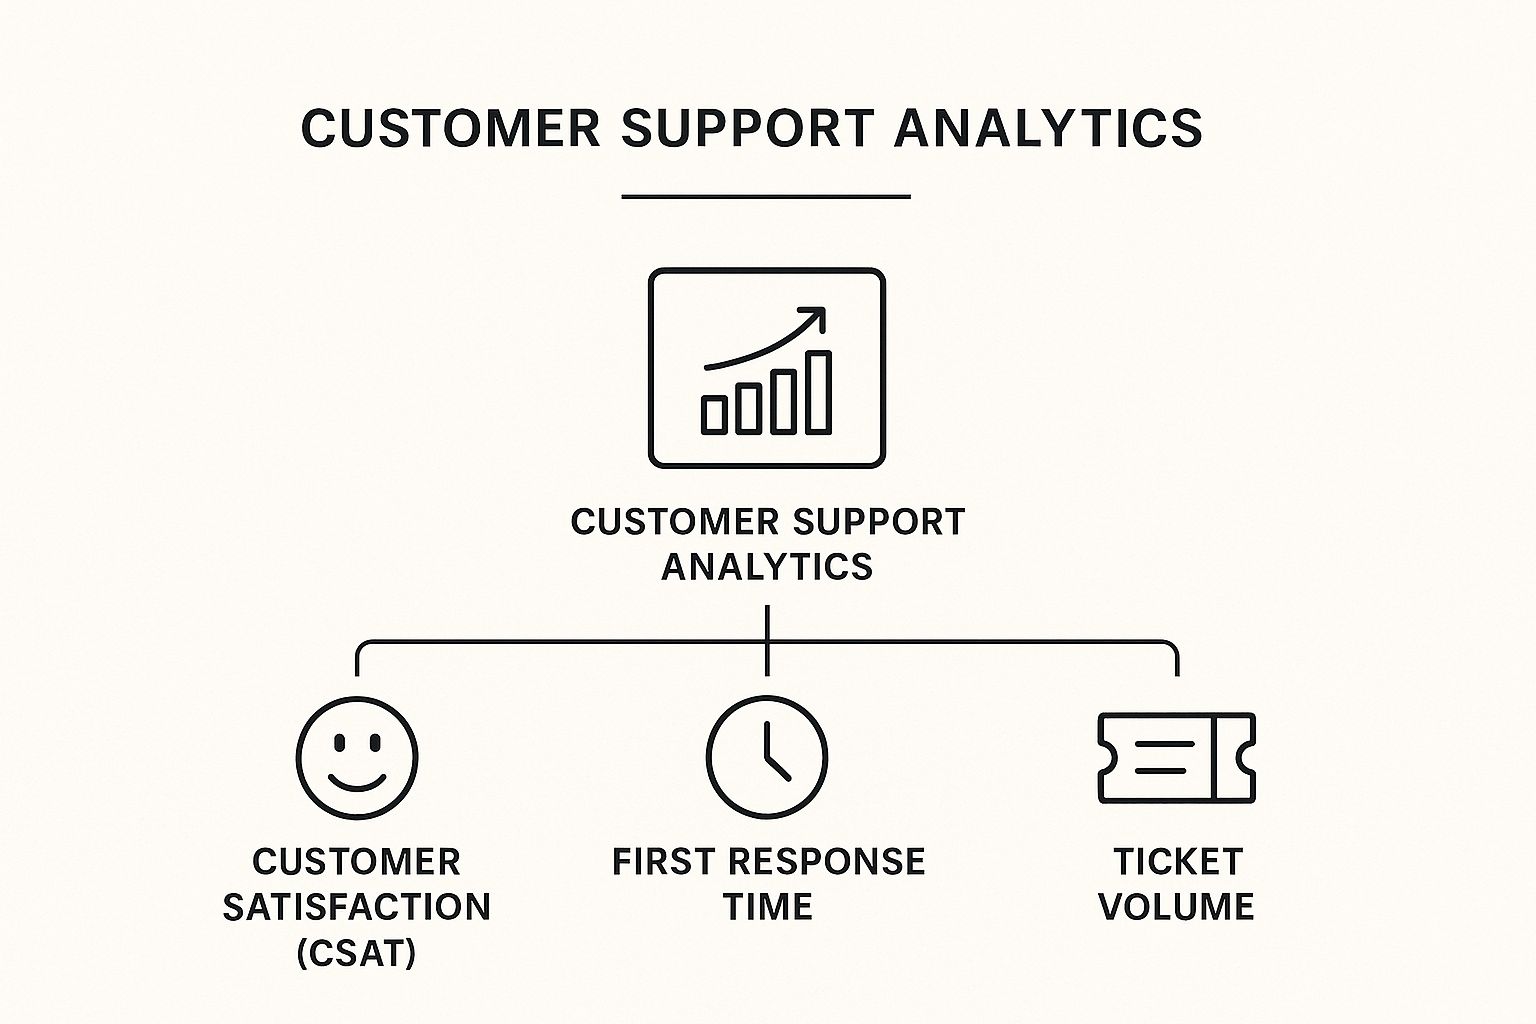
The infographic above gives us a helpful overview of key customer support analytics. Think of it like a family tree, branching out from the main idea of customer support performance down to specific measurements like Customer Satisfaction (CSAT), First Response Time, and Ticket Volume. These metrics aren't just numbers sitting in a spreadsheet; they're the vital signs of your customer support health. Seeing how they all connect paints a complete picture of how your support team is performing, so you can make improvements based on real data.
Think about it: would you rather use a scalpel or a sledgehammer? Focusing on the right metrics in customer support is like choosing the scalpel. It's not about measuring everything under the sun; it's about focusing on what truly matters. This targeted approach pinpoints the areas that really affect customer happiness, how smoothly your team operates, and ultimately, your bottom line. For a deeper dive into these metrics, check out our article on key metrics for your customer support team.
From Vanity Metrics to Actionable Insights
Many support teams find themselves drowning in vanity metrics. These are numbers that look impressive on reports but don't actually tell you anything useful about your business goals. Imagine a team celebrating a high number of handled tickets. While that might sound good at first, it doesn't tell the whole story. Are those interactions positive? Or could that high volume indicate a problem with the product that's causing a flood of complaints?
Instead of vanity metrics, successful companies focus on actionable metrics. These metrics offer real insights you can use to improve. First Response Time (FRT), for example, has a direct impact on customer satisfaction. Studies have shown again and again that a faster FRT leads to happier customers. And of course, there’s Customer Satisfaction (CSAT) itself, which directly measures how happy customers are with the support they receive.
Measuring What Matters: Essential Metrics for Growth
Beyond FRT and CSAT, other metrics can offer valuable insights. Consider Resolution Time, which measures how long it takes to completely solve a customer's problem. This digs deeper than just the initial response, looking at the efficiency of the entire support process. A long resolution time might highlight bottlenecks that need attention. Similarly, the Customer Effort Score (CES) gauges how much effort a customer has to put in to get their issue resolved. A high CES is a red flag, suggesting a frustrating and difficult support experience.
To help you compare these vital metrics, we've compiled the following table:
Essential Customer Support Metrics Comparison
A comprehensive breakdown of key metrics, their purposes, ideal benchmarks, and business impact
| Metric | Purpose | Industry Benchmark | Business Impact | Measurement Frequency |
|---|---|---|---|---|
| First Response Time (FRT) | Measures how quickly a customer receives an initial response | Varies by industry, but under 1 hour is generally considered good | Improved customer satisfaction, reduced anxiety | Ongoing, real-time |
| Customer Satisfaction (CSAT) | Measures customer happiness with their support experience | Aim for 80% or higher | Increased customer loyalty, positive word-of-mouth | After each resolved ticket |
| Resolution Time | Measures the time taken to fully resolve a customer issue | Aim for the lowest time possible while maintaining quality | Improved efficiency, reduced customer frustration | Ongoing, per ticket |
| Customer Effort Score (CES) | Measures how much effort a customer expends to get their issue resolved | Aim for a low score, indicating minimal effort | Reduced churn, improved customer experience | After each resolved ticket |
| Ticket Volume | Tracks the number of support tickets received | This metric needs to be contextualized with other metrics to be useful | Can indicate product issues or efficiency levels | Ongoing, daily/weekly/monthly |
This table provides a clear snapshot of what each metric aims to achieve, how they relate to the bigger picture, and how frequently you should be measuring them. Focusing on these crucial metrics allows you to identify specific areas for improvement, leading to more efficient processes and happier customers.
This screenshot from Salesforce shows a comprehensive customer support analytics dashboard. Notice how it visually presents key metrics, allowing support teams to quickly spot trends and areas that need attention. This kind of visual representation goes beyond simply collecting data; it empowers teams to make strategic decisions.
By carefully tracking and analyzing these actionable metrics, support teams gain a deep understanding of their performance. This shift from vanity metrics to actionable insights transforms customer support analytics from a simple reporting function into a powerful engine for business growth.
How AI Transforms Support Analytics Into Predictive Power

This screenshot shows how AI can be integrated into a helpdesk to automate responses and resolutions. It’s a visual representation of a chatbot setup, demonstrating the ability to customize and manage the automated support experience. The platform walks you through the process, making it simpler to tailor the bot’s replies to specific customer questions. This visual approach makes the potentially complex world of AI much more accessible to support teams.
Imagine knowing which customers are on the verge of leaving or which products are likely to trigger a flood of support tickets. This is the potential of customer support analytics powered by AI. AI is no longer a futuristic fantasy; it's a practical tool used by leading support teams today. It helps shift from reacting to data to proactively anticipating customer needs.
Predicting Customer Behavior With AI
Think of predictive routing as an intelligent traffic management system for your support tickets. Rather than randomly assigning tickets, AI analyzes key factors:
- Customer history
- Issue type
- Customer sentiment
This information routes each inquiry to the most qualified agent.
Sentiment analysis goes beyond simply categorizing words as positive or negative. It dives into the nuances of language, recognizing emotional patterns in thousands of customer interactions. This helps understand the real reasons behind customer satisfaction – and dissatisfaction.
For example, AI might sense frustration in a customer’s tone, even if they haven't explicitly voiced a complaint. This early alert allows support teams to proactively address the issue, possibly resolving it before it escalates into a bigger problem. This proactive approach is where the strategic implementation of AI truly shines.
AI is playing an increasingly vital role in support analytics. For more on this, check out this guide on video analytics software. The use of AI in customer support is growing globally, reshaping how we approach analytics. By 2025, approximately 80% of companies plan to use AI-powered chatbots. NIB Health Insurance, for instance, saved $22 million and cut support costs by 60% by implementing AI assistants. Learn more about the rise of AI in customer service.
Choosing the Right AI Tools
Not all AI solutions are equal. Some are incredibly effective, while others can be costly distractions. The key is to select tools that integrate smoothly with your current systems and boost your team’s existing skills. This means judging AI based on its practical use, not just how technically impressive it seems.
Focus on your support team’s specific needs. For example, if high ticket volumes are an issue, an AI-powered chatbot might be a smart investment.
Effective AI implementation is not about replacing human agents. It’s about giving them the tools and information they need for more efficient workflows. This combined approach leverages the best of both human and artificial intelligence, creating a support system that's efficient and empathetic. The result? Improved customer satisfaction, lower operating costs, and a more sustainable support model.
Turning Support Data Into Customer Loyalty And Revenue
Let's talk about how the information you gather from your support team can actually build stronger customer relationships and boost your bottom line. This is where customer support analytics comes into play. It's not just about tracking numbers; it's about understanding the customer journey. Think of it like connecting the dots to see the bigger picture of your customer's experience. Every interaction, whether it's a quick response, a positive survey, or a resolved issue, adds to that picture.
Unlocking the Emotional Drivers of Loyalty
Customer support analytics lets you peek behind the curtain of customer behavior. By analyzing the customer journey, you can spot trends and figure out what truly makes customers stick around. For instance, are people abandoning their online shopping carts because the checkout process is confusing? Is one particular product feature causing a flood of support tickets? These insights help you tackle the root of the problem, not just the symptoms.
This data also opens doors to more personalized support. Imagine a customer who keeps contacting support about the same issue. By noticing this pattern, you can reach out proactively and offer customized help. This personal touch can turn a potentially frustrating experience into a positive one.
This sample analytics dashboard, for example, visually represents key metrics like resolution time and customer satisfaction. It's like a quick health check for your support operations.
These visual representations make it easy to identify areas for improvement and respond to emerging issues quickly. This allows for more proactive strategies to boost customer satisfaction.
Transforming Support From Cost Center to Revenue Driver
Now, let's talk about the connection between customer support analytics, customer retention, and your revenue. Studies show that 73% of consumers will jump ship to another brand after several bad experiences, but 75% are happy to spend more with companies that consistently provide top-notch customer service. Discover more insights about the impact of customer service. This clearly highlights how crucial positive experiences are for driving revenue.
By using analytics to streamline support and make it more personal, you create memorable interactions. These positive interactions can transform frustrated customers into loyal advocates for your brand. Want to learn more about how AI is changing the game for support analytics? Check out resources on AI-driven analytics. Also, if you're looking for ways to keep your customers from leaving, take a look at this guide: Check out our guide on reducing customer churn. This approach shifts your support function from a cost center to a revenue generator. By using customer data wisely, you can proactively address problems, personalize interactions, and ultimately, build stronger customer relationships that lead to increased loyalty and higher revenue.
To illustrate the impact of customer experience on your bottom line, let's look at some data. The table below shows how support quality directly affects key business outcomes:
| Experience Quality | Customer Retention Rate | Revenue Impact | Referral Likelihood | Support Cost per Customer |
|---|---|---|---|---|
| Poor | 20% | -15% | 5% | $25 |
| Average | 50% | 0% | 20% | $15 |
| Good | 80% | +10% | 50% | $10 |
| Excellent | 95% | +25% | 80% | $5 |
As you can see, investing in a better customer experience leads to higher customer retention, increased revenue, and more referrals, all while potentially lowering the cost of support per customer. This is because happy customers are more likely to stick around, spend more, and recommend your business to others.
From Spreadsheet Chaos To Strategic Intelligence

This screenshot shows a customer support analytics dashboard inside Helpscout. Notice how clearly it displays key performance indicators. Metrics like resolution time and customer satisfaction are easy to understand at a glance. This digestible format helps support teams quickly spot performance trends and find areas for improvement.
Switching from disorganized spreadsheets to meaningful customer support analytics isn't just about buying new software. It's a fundamental shift in how your company views and uses customer data. It's about moving beyond simple data collection and embracing a strategic approach. One that transforms data into actionable insights. For example, using a CRM like Odoo can significantly enhance customer loyalty by providing valuable insights into customer behavior and preferences. You can learn more about optimizing customer relationships with Odoo here: Odoo CRM for customer relationships.
Building an Analytics System That Drives Decisions
Imagine trying to build a house without blueprints. That's what it's like to implement analytics without a clear strategy. You end up with a bunch of disconnected reports that just gather dust, instead of a system that informs decisions.
Successful teams start by breaking down data silos. They connect information from various sources—their CRM, helpdesk software, and even social media. This creates a unified view of the customer. Think of it like piecing together a puzzle to see the complete picture of each customer interaction.
Next, they focus on the people involved. Getting everyone on board with the change is essential. This means showing skeptical team members the value of customer support analytics. It also means providing proper training so everyone can use the new tools effectively.
Finally, they avoid "analysis paralysis." This happens when teams get overwhelmed by the amount of data. The solution is to start small. Focus on a few key metrics tied to your business goals. Then, gradually expand your analysis as the team becomes more comfortable and skilled.
Choosing the Right Tools and Creating Effective Reporting
Choosing the right tools is key. It's about finding the sweet spot between budget-friendly solutions and those that meet your specific needs. A small startup might need a simple, easy-to-use platform. A large enterprise might need a more powerful, customizable solution.
Creating reports that inform, not overwhelm, is just as important. Reports should be clear, concise, and focused on actionable insights. Avoid cluttered dashboards packed with irrelevant metrics.
Real-world examples offer valuable lessons. One company simplified its reporting by focusing on just three key metrics: First Response Time, Customer Satisfaction (CSAT), and Resolution Time. This allowed them to quickly identify and fix bottlenecks. The result? A 20% increase in CSAT scores.
Implementing effective customer support analytics is a continuous journey. It takes a strategic mindset, the right tools, and a commitment to constant improvement. By following these principles, you can transform your support data from messy spreadsheets into strategic intelligence, boosting customer satisfaction and operational efficiency.
Real Companies, Real Results: Analytics Success Stories
Sometimes, the best way to understand something powerful is to see it in action. Think of customer support analytics like a high-performance engine – you can read all about horsepower and torque, but nothing beats witnessing the car on the track. This section explores real-world case studies that show how analytics can transform customer support, offering practical insights into winning strategies and the measurable returns they can bring.
From Startup to Scale-Up: 10x Growth With Basic Metrics
Imagine a fast-growing startup suddenly swamped with support tickets. Instead of getting lost in a sea of data, they focused on two key metrics: First Response Time (FRT) and Resolution Time. Think of these like a restaurant’s order time and dining time – crucial for customer satisfaction. By carefully tracking these metrics, they found a bottleneck in their email support, like a slow kitchen holding up the whole restaurant. They implemented a new ticketing system that prioritized urgent requests and routed them to specialized agents – like adding an extra chef for complex dishes. The result? A tenfold increase in support capacity without a huge increase in staff.
Enterprise-Level Churn Reduction: AI-Driven Analytics
A large enterprise was wrestling with customer churn – like a leaky bucket constantly losing water. They used AI-powered sentiment analysis – think of it as an emotional radar – to analyze customer interactions across all channels. This revealed a pattern of negative feedback around a specific product feature – like discovering a persistent leak in one spot. Armed with this knowledge, they redesigned the feature and proactively told at-risk customers about the improvements – patching the leak before more water was lost. This led to a 40% reduction in churn, saving millions in lost revenue.
E-Commerce Success: Boosting Satisfaction and Cutting Costs
An e-commerce retailer wanted the best of both worlds: happier customers and lower support costs. They used customer support analytics to dissect their support interactions. This showed that many customers contacted support with simple questions easily answered through self-service resources – like asking a store clerk where the restroom is when there's a sign right there. By investing in a comprehensive FAQ section and an AI-powered chatbot – like putting up clear signage throughout the store – they reduced support tickets by 30% and increased customer satisfaction by 15%. This was a win-win: empowering customers and streamlining support.
This screenshot shows a customer support analytics dashboard. It’s like the control panel for your support operation, visually displaying key metrics like first response time, resolution time, and customer satisfaction. These visual snapshots help support teams quickly understand performance trends and spot areas for improvement. The platform lets you filter data to analyze specific timeframes, support channels, or customer segments – like zooming in on a specific area of your business.
Financial Services: Sentiment Analysis for Agent Training
A financial services firm wanted to boost agent performance. They used sentiment analysis – again, that emotional radar – to pinpoint training needs. The analysis revealed that agents struggled with complex technical questions, leading to negative customer sentiment. This prompted targeted training programs focusing on technical skills and product knowledge – giving agents the tools they needed to succeed. The result? A 35% improvement in agent performance, reflected in higher customer satisfaction and shorter handling times.
These real-world stories highlight how versatile and impactful customer support analytics can be. From startups to large corporations, businesses are using analytics to enhance customer experiences, optimize their operations, and achieve significant business outcomes. By focusing on the right metrics, using the right technologies, and acting on data-driven insights, companies can transform their support functions from cost centers into engines of growth and customer loyalty.
Your Roadmap To Customer Support Analytics Success
This section lays out a clear, actionable plan for using customer support analytics to boost your business. Think of it as a map guiding you through the first steps, showing you potential bumps in the road, and highlighting key milestones to track your progress.
Building Your Foundation: First Steps
Before you dive in, take a moment to define your objectives. What do you want to get out of customer support analytics? Is it faster resolution times? Happier customers? Or perhaps spotting churn risks before they happen? These goals will shape your strategy and help you pick the right metrics. For instance, if you're focused on customer happiness, you'd likely prioritize metrics like CSAT (Customer Satisfaction) and CES (Customer Effort Score). Need some inspiration? Check out this post: Boost Customer Satisfaction & Improve Help Desk Efficiency Now.
Next, take stock of your current analytics setup. Are you juggling spreadsheets or do you have a central system for collecting and analyzing support data? Knowing your starting point helps you plan the scope of your implementation. It's like planning a trip – you need to know where you're starting from to figure out the best route.
Finally, get your team and executives on board. Show them how customer support analytics can deliver a strong return on investment. This buy-in is essential for securing resources and making sure your project succeeds in the long run.
Avoiding Common Pitfalls
Even with the best intentions and resources, analytics projects can hit snags. One common trap is “analysis paralysis” – getting bogged down by the sheer amount of data. The solution? Start small. Focus on a few key metrics and gradually expand your analysis.
Another pitfall is overlooking the human element. Training your team and building a data-driven culture is just as important as the technology you choose. Remember, the goal is to empower your agents with data, not replace them. Think of data as a powerful tool that your team can use to do their jobs even better.
Lastly, don't get caught up in vanity metrics. Prioritize actionable metrics that tie directly to your business objectives. For example, the number of tickets closed might look impressive, but it doesn't tell you how satisfied your customers are or how well your support team is performing.
Tracking Your Progress: Key Milestones
As you implement customer support analytics, check your progress against key milestones. These could include integrating data sources, setting up new analytics tools (Google Analytics is a popular choice), and training your team. Regular reviews will help you spot any roadblocks and keep things on track.
Another crucial milestone is establishing clear reporting. Create dashboards that clearly show key metrics and offer actionable insights. Make these dashboards accessible to everyone involved, so everyone can make data-driven decisions.
Finally, remember that customer support analytics is a journey, not a destination. Continuously review your metrics, refine your strategies, and adapt to evolving customer expectations. This iterative approach will ensure you stay ahead of the game and get the most from your support data. Ready to elevate your customer support? Explore Screendesk, the video-based solution transforming helpdesk interactions. Discover Screendesk today!