
In today's competitive market, simply offering 'good' customer service isn't enough. To truly stand out, your support strategy must be data-driven, moving beyond gut feelings to focus on measurable outcomes. This is where tracking the right customer service KPIs (Key Performance Indicators) makes a critical difference. These metrics transform guesswork into a clear roadmap, highlighting your team's strengths and revealing precise opportunities for improvement. They are the foundation for delivering exceptional experiences that foster loyalty and drive sustainable growth.
But which KPIs actually matter? This guide gets straight to the point, breaking down the 8 most impactful customer service KPIs your team should be tracking. We’ll go beyond simple definitions to provide calculation formulas, industry benchmarks, and actionable tips to improve each one. We will also show how a video-first tool like Screendesk can revolutionize your data collection and resolution efficiency. Of course, even the best tracking is only as effective as the tools you use, as reliable business phone and internet providers are pivotal for delivering consistently excellent support. Let's dive into the metrics that will help you build a support engine that truly performs.
1. Customer Satisfaction Score (CSAT)
The Customer Satisfaction Score, or CSAT, is one of the most direct and widely used customer service KPIs. It measures how satisfied a customer is with a specific, recent interaction. This could be anything from a support ticket resolution to a product purchase. It answers the simple, yet powerful, question: "How satisfied were you with your experience today?"
CSAT is typically measured through a single-question survey sent immediately after an interaction. Customers rate their satisfaction on a scale, often 1-5 or 1-10. The final score is presented as the percentage of customers who gave a "satisfied" rating (e.g., a 4 or 5 on a 5-point scale).
Why It's a Top KPI
CSAT's strength lies in its simplicity and immediacy. It provides a real-time pulse on your service quality at specific touchpoints. For instance, an Apple Store receipt might include a link to rate your in-store experience, while Zappos often sends follow-up surveys after a support call. These immediate feedback loops allow you to pinpoint exact moments of success or failure in the customer journey.
Key Insight: Use CSAT to get a granular, transactional view of customer happiness. It helps you identify which specific agents, channels, or processes are delighting customers and which need improvement.
How to Implement and Improve CSAT
To get the most out of your CSAT surveys, timing and brevity are crucial.
- Send surveys immediately after an interaction while the experience is fresh in the customer's mind.
- Keep surveys short; a single question is often best. Adding more questions reduces completion rates.
- Segment your results by channel (email, chat, phone), agent, or issue type to uncover deeper insights.
- Act on feedback, especially negative scores. Following up with dissatisfied customers can turn a poor experience into a loyal relationship.
The following bar chart illustrates common CSAT benchmarks across various industries.
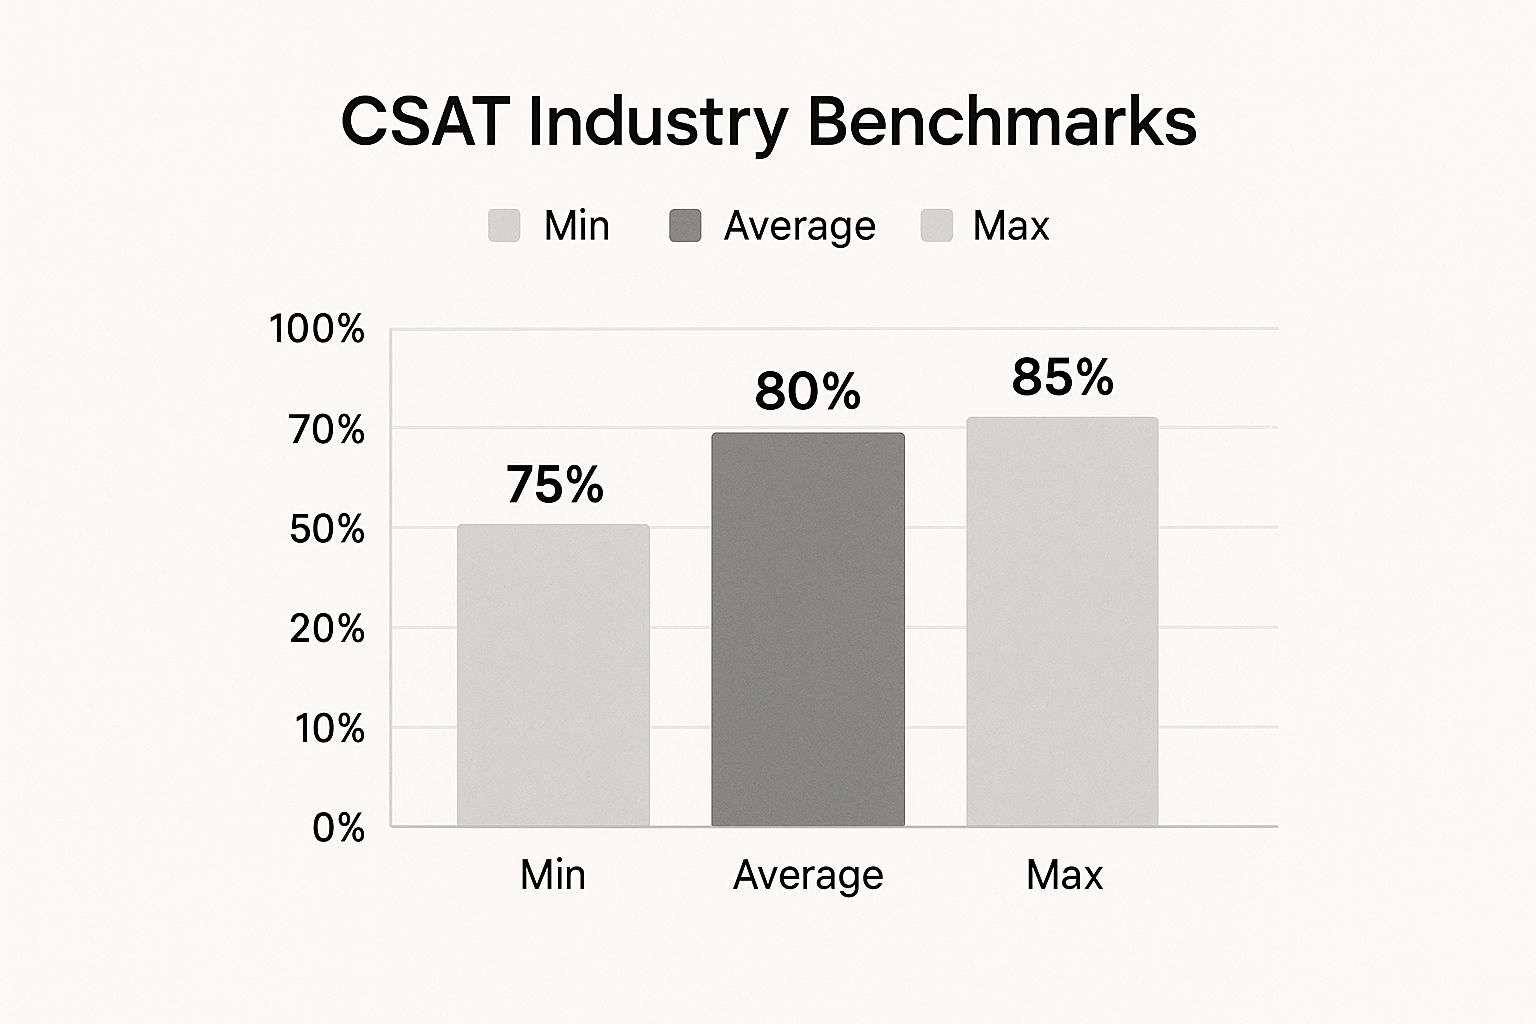
This chart shows that while top-performing companies can reach an 85% satisfaction score, the average hovers around 80%, providing a solid benchmark for your team to target.
2. Net Promoter Score (NPS)
The Net Promoter Score, or NPS, is a powerful loyalty metric and a crucial customer service KPI. It measures the likelihood of a customer recommending your company, product, or service to others. Popularized by Fred Reichheld and Bain & Company, it hinges on a single, direct question: "On a scale of 0-10, how likely are you to recommend us to a friend or colleague?"
Based on their response, customers are segmented into three categories: Promoters (score 9-10), who are loyal enthusiasts; Passives (score 7-8), who are satisfied but unenthusiastic; and Detractors (score 0-6), who are unhappy customers. The final NPS score is calculated by subtracting the percentage of Detractors from the percentage of Promoters, resulting in a score ranging from -100 to +100.
Why It's a Top KPI
NPS provides a high-level view of customer loyalty and its correlation with long-term business growth. Unlike transactional metrics, it gauges the overall relationship a customer has with your brand. For example, Apple and Tesla consistently post high NPS scores (often above 70), reflecting strong brand loyalty that translates into repeat business and powerful word-of-mouth marketing. Southwest Airlines and Salesforce also use NPS to track customer loyalty across different touchpoints.
Key Insight: Use NPS to measure overall brand health and customer loyalty. It's less about a single interaction and more about the customer's complete perception of your company, making it a strong predictor of future growth.
How to Implement and Improve NPS
To effectively leverage NPS, focus on context and long-term trends rather than just a single number.
- Survey at key milestones, such as after onboarding or a major purchase, to capture meaningful feedback on the overall experience.
- Always ask a follow-up question like "What is the primary reason for your score?" to understand the "why" behind the number.
- Focus on converting Passives into Promoters; these customers are often on the fence, and a small improvement can create a loyal advocate.
- Track trends over time instead of obsessing over a single score. A rising NPS indicates your improvement efforts are working.
By benchmarking your score against industry competitors and acting on the qualitative feedback you receive, you can turn NPS from a simple metric into a strategic tool for building a more customer-centric business.
3. First Contact Resolution (FCR)
First Contact Resolution (FCR) is one of the most powerful customer service KPIs for measuring both efficiency and customer satisfaction simultaneously. It tracks the percentage of customer inquiries that are fully resolved during the first interaction, eliminating the need for any follow-up contact from the customer. A high FCR rate signifies that your agents are knowledgeable, empowered, and equipped to solve problems effectively on the first attempt.

This KPI is typically measured by tracking cases or tickets that are closed after a single interaction, often confirmed through a post-interaction survey asking, "Was your issue resolved in this one contact?" or through internal case tracking logic. It directly correlates with reduced operational costs and increased customer loyalty, as customers deeply appreciate not having to call back or send another email.
Why It's a Top KPI
FCR's value lies in its direct impact on the customer experience and operational efficiency. When a customer’s issue is resolved quickly, it minimizes their effort and boosts their confidence in your brand. Companies like American Express and Zappos maintain high FCR rates by heavily investing in agent training and empowerment. For instance, Zappos gives agents the authority to make decisions on the spot, preventing escalations and callbacks. This approach not only solves the immediate problem but also builds long-term trust.
Key Insight: Focus on FCR to reduce customer effort and operational costs. A single-contact resolution is a win-win: the customer is happy, and your team can handle more unique inquiries instead of managing repeat contacts.
How to Implement and Improve FCR
Boosting your FCR rate requires a strategic investment in your team and tools. For a comprehensive guide, you can learn more about how to improve First Contact Resolution.
- Invest in knowledge bases: Equip agents with a comprehensive, easily searchable knowledge base to find accurate answers quickly.
- Empower your agents: Grant them the authority to handle common issues like refunds or account changes without needing supervisor approval.
- Implement robust case tracking: Use a system that accurately links related customer contacts to identify and analyze repeat inquiries.
- Balance with quality metrics: Avoid incentivizing agents to close tickets prematurely. Pair FCR goals with CSAT scores to ensure resolutions are both fast and satisfactory.
The following video explains how to accurately measure FCR to drive meaningful improvements.
4. Average Response Time
Average Response Time is a fundamental customer service KPI that measures the average time it takes for a support agent to provide an initial reply to a customer inquiry. This metric is tracked across all communication channels, including email, live chat, social media, and phone calls. It directly addresses the customer's need for a quick acknowledgment, setting the tone for the entire support interaction.
This KPI is calculated by summing up all the individual first response times within a given period and dividing that total by the number of tickets responded to. For example, if you responded to three tickets in 20, 30, and 40 minutes, your average response time would be 30 minutes. The goal is to keep this number as low as possible without sacrificing the quality of the first interaction.
Why It's a Top KPI
In an era of instant gratification, speed is a critical component of a positive customer experience. A low Average Response Time demonstrates that your team is attentive, efficient, and values the customer's time. Companies known for excellent service often set aggressive internal benchmarks. For instance, Buffer is famous for its social media responses, often under 30 minutes, while Intercom aims for a 5-minute average response time on its live chat.
Key Insight: Average Response Time is a leading indicator of customer satisfaction. A fast initial response can de-escalate a frustrated customer and builds confidence that their issue will be resolved, even if the final solution takes longer.
How to Implement and Improve Average Response Time
Effectively managing this KPI requires a multi-channel strategy and clear internal processes.
- Set channel-specific targets. A 15-minute response on Twitter is excellent, but a 2-hour response via email is also strong. Tailor your goals to customer expectations for each platform.
- Use automated acknowledgments. For channels like email, an immediate automated reply can confirm receipt and set expectations, which helps manage perceptions while an agent becomes available.
- Balance speed with quality. While a fast response is good, ensure it’s not at the expense of First Contact Resolution. The initial reply should be helpful, not just fast.
- Implement escalation rules. Create automated workflows that flag tickets nearing your response time limit, ensuring high-priority or aging inquiries get immediate attention. For more strategies, learn how to improve your response time on blog.screendesk.io.
5. Customer Effort Score (CES)
The Customer Effort Score, or CES, is a powerful transactional metric that flips the traditional satisfaction question on its head. Instead of asking how satisfied a customer was, it measures how much effort a customer had to exert to get an issue resolved or a request fulfilled. It answers the question: "How easy was it to handle your request?"
Popularized by research from CEB (now part of Gartner), CES operates on the principle that reducing customer effort is a more reliable driver of loyalty than simply delighting them. It's typically measured with a single question on a scale, such as "To what extent do you agree with the following statement: The company made it easy for me to handle my issue," with answers ranging from "Strongly Disagree" to "Strongly Agree."
Why It's a Top KPI
CES is one of the most predictive customer service KPIs for future customer loyalty. High-effort experiences, like having to repeat information or switch channels, are a primary cause of disloyalty. By focusing on making interactions seamless, companies can significantly reduce customer churn. For example, Google uses CES to optimize its support portal, and Slack tracks effort during onboarding to ensure new users can get started with minimal friction.
Key Insight: Focus on reducing effort to build loyalty. CES pinpoints the specific points of friction in your customer journey, allowing you to remove obstacles and create a smoother, more efficient experience.
How to Implement and Improve CES
Effectively using CES requires targeting the right moments and acting decisively on the feedback.
- Survey immediately after key interactions where effort is a factor, such as after a support ticket is closed or a complex transaction is completed.
- Use simple, clear language in your survey question. The focus should be unambiguously on the ease of the experience.
- Prioritize high-effort feedback. Segment your results to find the processes causing the most customer friction and tackle those first.
- Map effort scores to specific stages in the customer journey to identify which touchpoints are creating the most work for your customers.
6. Customer Retention Rate
The Customer Retention Rate measures the percentage of customers who continue to do business with a company over a specific time period. While not always seen as a direct service metric, it is one of the most powerful customer service KPIs for evaluating the long-term impact of your support efforts on business health. It directly answers the question: "Are our service and product experiences compelling enough to make customers stay?"
This KPI is calculated by taking the number of customers at the end of a period, subtracting new customers acquired during that period, dividing by the number of customers at the start of the period, and multiplying by 100. A high retention rate signifies strong customer loyalty and satisfaction.
Why It's a Top KPI
Customer Retention Rate moves beyond transactional satisfaction to measure the overall health of your customer relationships. Excellent customer service is a cornerstone of retention. For example, Amazon Prime boasts an annual retention rate of over 90%, partly because its seamless service and support make the membership indispensable. Similarly, Salesforce and Adobe Creative Cloud report retention rates around 90%, driven by robust support that helps users succeed with complex products.
Key Insight: Customer Retention Rate is the ultimate indicator of long-term value creation. It reflects how well your entire customer experience, especially your support, nurtures loyalty and prevents churn.
How to Implement and Improve Customer Retention Rate
Improving retention is a strategic effort that relies on proactive, data-driven service.
- Segment your customers by value, product usage, or support history to identify at-risk groups.
- Identify early warning signs of churn, such as a drop in product usage or an increase in support tickets.
- Implement proactive outreach campaigns to re-engage customers who show signs of drifting away.
- Combine retention data with CSAT and NPS scores to understand why customers are leaving or staying.
- Focus on improving the experience for high-value customers to maximize the financial impact of your retention efforts. For a deeper dive, learn more about how to increase customer retention.
7. Average Handle Time (AHT)
Average Handle Time, or AHT, is a core efficiency metric and one of the most monitored customer service KPIs, especially in call centers. It measures the average total duration of a single customer interaction, from the moment an agent initiates contact until they complete all related after-call work. This includes talk time, hold time, and any wrap-up tasks like logging notes or sending follow-up emails.
AHT is calculated by adding total talk time, total hold time, and total after-call work, then dividing that sum by the total number of interactions. The goal isn't just to keep this number low, but to optimize it for both efficiency and service quality.
Why It's a Top KPI
AHT is a powerful KPI for operational planning and cost management. It directly impacts staffing levels, resource allocation, and overall contact center efficiency. For example, a technical support team for a software company might accept a higher AHT of 8-12 minutes for complex issues, while an e-commerce brand might target 3-4 minutes for simple order inquiries. This KPI helps leaders understand the resources required to serve their customers effectively.
Key Insight: Use AHT to balance agent efficiency with service quality. A low AHT is meaningless if it leads to unresolved issues and low satisfaction. The key is to find the optimal time that allows for thorough, high-quality support without wasting resources.
How to Implement and Improve AHT
Effectively managing AHT requires a focus on empowering agents, not just rushing them.
- Set realistic targets based on interaction complexity and type. A billing question will naturally take less time than a technical troubleshooting session.
- Provide agents with efficient tools, such as a comprehensive knowledge base and streamlined CRM, to reduce search and data entry time.
- Monitor AHT alongside quality metrics like CSAT and First Contact Resolution. A sudden drop in AHT coupled with lower satisfaction scores indicates a problem.
- Analyze trends, not just individual calls. Use AHT data to identify common time-consuming issues and develop more efficient processes or training to address them.
8. Service Level Agreement (SLA) Compliance
Service Level Agreement (SLA) Compliance is a critical customer service KPI that measures a support team's ability to meet its promises. It represents the percentage of customer interactions that are handled within predefined timeframes and standards. These agreements outline the level of service a customer can expect, covering metrics like first response time, resolution time, and system uptime.
SLA compliance is calculated by dividing the number of interactions that met their targets by the total number of interactions, then multiplying by 100. For instance, if 950 out of 1000 tickets are resolved within the promised timeframe, your SLA compliance is 95%. This KPI is particularly vital in B2B contexts where service guarantees are often part of a contract.
Why It's a Top KPI
SLA Compliance goes beyond customer satisfaction; it's about upholding your brand's commitment and building trust. While CSAT measures perception, SLA compliance measures performance against a formal promise. For example, enterprise software companies often commit to 99.9% uptime, and help desk services typically maintain 95% SLA compliance for response times. Failing to meet these targets can result in financial penalties and, more importantly, a loss of customer confidence and business.
Key Insight: SLA Compliance is the ultimate measure of your team's reliability. Use it to ensure you are consistently delivering on your service promises, which is fundamental for customer retention, especially in high-stakes B2B relationships.
How to Implement and Improve SLA Compliance
Effective SLA management requires clear definitions, proactive monitoring, and continuous refinement.
- Set realistic and achievable SLA targets that align with both customer expectations and your team's capacity.
- Implement tiered SLAs based on issue priority. A critical system outage should have a much faster response time than a minor user query.
- Monitor compliance in real-time with dashboards and automated alerting systems to flag potential breaches before they happen.
- Regularly review and adjust SLA targets based on historical performance and evolving customer needs. What worked last year may not be competitive today.
- Communicate SLA performance transparently with customers, as this builds trust and manages expectations effectively.
Customer Service KPI Comparison Overview
| Metric | Implementation Complexity 🔄 | Resource Requirements ⚡ | Expected Outcomes 📊 | Ideal Use Cases 💡 | Key Advantages ⭐ |
|---|---|---|---|---|---|
| Customer Satisfaction Score (CSAT) | Low – simple surveys, easy setup | Low – cost-effective surveys | Immediate feedback on specific interactions | Quick post-interaction feedback, benchmarking | Easy to understand; actionable; quick insights |
| Net Promoter Score (NPS) | Low – single standardized question | Low – simple survey, broad adoption | Predicts loyalty and business growth | Measuring customer loyalty and advocacy | Strong growth correlation; benchmarkable |
| First Contact Resolution (FCR) | Medium – requires tracking systems | Medium to High – multi-channel tracking | Improves operational efficiency and customer satisfaction | Customer service efficiency and effectiveness | Reduces repeat contacts; boosts satisfaction |
| Average Response Time | Medium – requires automated tracking | Medium – ongoing monitoring tools | Faster response improves customer satisfaction | Managing service levels and staffing | Easy to measure; supports SLA compliance |
| Customer Effort Score (CES) | Low to Medium – survey design critical | Low – straightforward surveys | Predicts loyalty by measuring effort in experience | Identifying friction points, improving processes | Strong loyalty predictor; actionable insights |
| Customer Retention Rate | Medium – needs customer activity data | Medium – CRM and analytics tools | Measures long-term loyalty and business stability | Long-term customer loyalty and revenue forecasting | Direct link to profitability; stable growth indicator |
| Average Handle Time (AHT) | Medium – comprehensive interaction tracking | Medium – requires detailed call logging | Helps optimize agent efficiency and operational costs | Resource planning and agent productivity | Supports staffing; identifies training needs |
| SLA Compliance | Medium to High – predefined standards and monitoring | Medium to High – automated reporting tools | Ensures service quality and reliability | Meeting contractual service commitments | Builds trust; sets clear targets; proactive management |
From Metrics to Momentum: Turning KPIs into Action
Navigating the world of customer support without clear data is like sailing a ship without a compass. Throughout this guide, we've unpacked eight of the most critical customer service KPIs, from the loyalty-focused Net Promoter Score (NPS) to the efficiency-driven Average Handle Time (AHT). Each metric offers a unique lens through which to view your team's performance and, more importantly, your customers' experience.
However, the true goal isn't just to track these numbers. The real transformation happens when you move from simply measuring data to actively using it as a catalyst for meaningful change. Viewing these KPIs in isolation can be misleading. A low AHT might seem great, but if it corresponds with a poor First Contact Resolution (FCR) and a low Customer Satisfaction Score (CSAT), it's a clear sign that agents are rushing through tickets without actually solving problems.
Weaving a Cohesive Strategy from Your Data
The most effective support leaders understand that these metrics are interconnected. They tell a complete story about your customer journey. By analyzing them together, you can diagnose underlying issues, identify coaching opportunities for your team, and build a more resilient and customer-centric support operation.
Here are the key takeaways to turn your KPI data into a powerful growth engine:
- Combine Quantitative and Qualitative Insights: Don't just look at the numbers. Pair your CSAT scores with customer comments. Analyze why your FCR is low by reviewing the specific tickets that required multiple follow-ups. This combined approach provides the "what" and the "why" behind your performance.
- Focus on Action, Not Just Observation: Once you identify a trend, create a plan. If Average Response Time is high, is it a staffing issue, a training gap, or a problem with your ticketing system's triage rules? Define the problem, implement a solution, and measure the impact.
- Empower Your Team with the Right Tools: Your agents are on the front lines, and their ability to perform directly impacts every single KPI. Equipping them with tools that reduce ambiguity and speed up problem-solving is one of the most direct ways to improve your metrics.
Mastering your customer service KPIs is about more than hitting targets; it's about building a culture of continuous improvement. It’s about ensuring every customer interaction reinforces their decision to do business with you. When you translate these metrics into strategic action, you don’t just improve support; you build lasting customer loyalty and a powerful competitive advantage.
Ready to see your KPIs like FCR and AHT improve dramatically? Screendesk empowers your agents to resolve issues faster with no-download screen sharing and video chat, directly from your existing help desk. Start your free trial today at Screendesk and turn complex customer problems into simple, quick resolutions.