
At its core, measuring operational efficiency is about comparing the value of your outputs (like your products or services) to the cost of your inputs (like labor, time, and materials). It’s a simple ratio that tells you how well you’re turning resources into revenue. Getting this right is the first step toward building a more profitable and resilient business.
What Is Operational Efficiency and Why It Matters

Operational efficiency isn't just a stuffy corporate buzzword; it's the engine that keeps your business healthy. Think of it as the direct relationship between what you spend and what you create. When a company has high operational efficiency, it’s able to produce top-notch goods or services with minimal waste, cost, and effort.
Of course, what "efficiency" looks like can vary wildly between industries. A manufacturing plant might measure it in units produced per hour. A software company, on the other hand, will probably care more about development cycle times or the number of bugs squashed per sprint. No matter the context, the goal is always the same: get the absolute most from the resources you put in.
Defining What 'Better' Looks Like
Before you start tracking anything, you need to be crystal clear on what "better" actually means for your team and your specific business strategy. It's incredibly easy to fall into the trap of chasing vanity metrics, like the total number of tasks completed, without ever considering their actual value. The trick is to focus on goals that tie directly back to your bottom line.
A great way to start is by asking some pointed questions about your core processes:
- For a support team: Is "better" responding to tickets faster, or is it resolving more customer issues on the very first contact?
- For a logistics company: Does "better" mean delivering more packages, or is it about reducing the fuel cost for each delivery?
- For a marketing agency: Is the goal to crank out more campaigns, or to improve the return on ad spend for the ones you already have?
Key Takeaway: True operational efficiency isn't about being busy; it's about being effective. Your goals have to reflect outcomes that generate real value, not just activity.
Answering these kinds of questions forces a shift in mindset—from simply doing more to achieving more with what you already have. That shift is what fuels sustainable growth.
Aligning Efficiency Goals with Business Strategy
Your efficiency goals can't exist in a silo. They need to be a direct reflection of your company's broader business objectives.
Let's say your company’s main strategic priority is to become the market leader in customer satisfaction. If that's the case, your operational goals should revolve around metrics like Customer Satisfaction (CSAT) scores and first-contact resolution rates.
On the other hand, if the strategy is to be the low-cost leader in your space, you'd want to focus on things like reducing labor costs per unit or slashing material waste. This alignment ensures that every tiny improvement you make helps push the entire organization in the right direction. For more practical ideas, exploring ways to increase efficiency in the workplace can give you a solid starting point for setting these goals.
Ultimately, knowing how to measure operational efficiency all starts here. When you set clear, strategic goals, you create a roadmap that makes it easy to pick the right metrics and make changes that genuinely move the needle.
Choosing the Right Metrics for Your Business
Once your goals are set, it’s time to pick the right Key Performance Indicators (KPIs) to track your progress. The trick here isn't to drown yourself in data by tracking every number imaginable. Instead, you want to zero in on a handful of powerful metrics that genuinely reflect your performance and tie directly back to your big-picture objectives.
It's helpful to think of your metrics as a balanced scorecard. If you only focus on speed, quality might suffer. If you only watch costs, you might stifle innovation. Mixing KPIs from different categories gives you a much richer, more honest understanding of how your business is actually doing. This approach stops you from accidentally improving one area by sacrificing another.
This is where you can see how different metrics tell a story together.
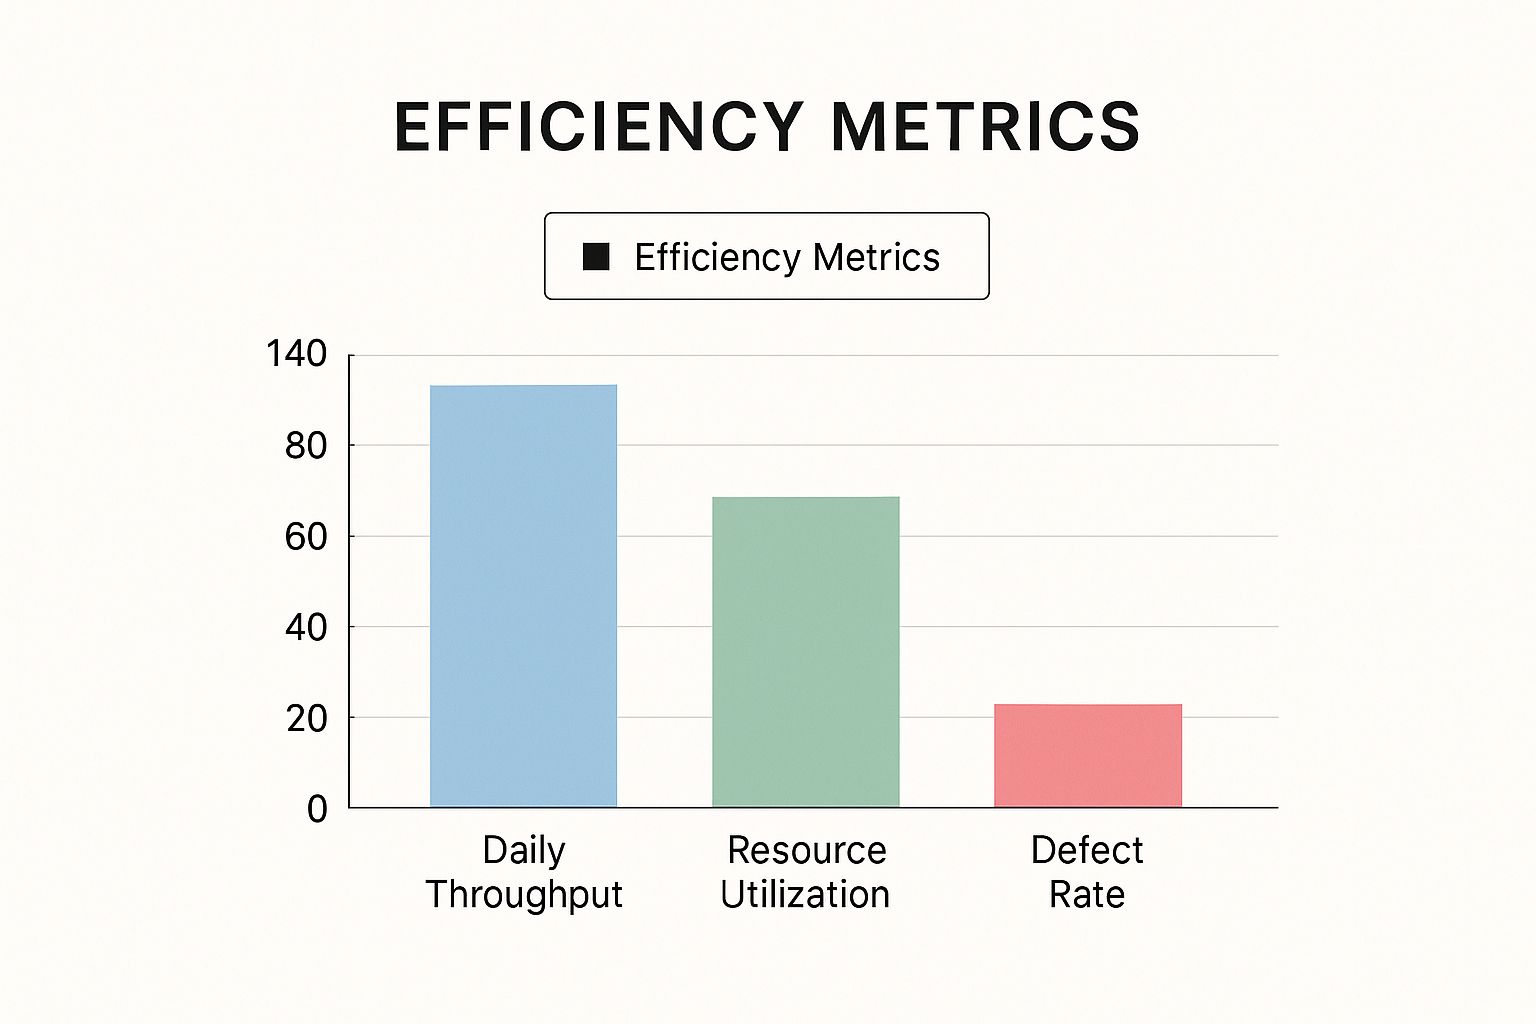
A high throughput number looks great on paper, but it loses its shine if your resource utilization is low or your defect rate is through the roof. It’s the combination of these numbers that paints the true picture of your operational health.
What Kinds of Metrics Should You Track?
To build that balanced view, I always recommend pulling metrics from a few key areas. Each one acts like a different lens, giving you a unique perspective on your business.
- Process Metrics: These are all about the speed and flow of your work. Think about cycle time (the total time it takes to complete a process from start to finish) or throughput (how many items you can produce in a set period). They tell you how smoothly things are running.
- Financial Metrics: This is where operations meet the bottom line. KPIs like operating margin and cost per unit are classics for a reason—they show how effectively you turn business activities into profit.
- Resource Metrics: This is all about getting the most out of what you have. Capacity utilization tells you how much of your potential output you're actually using. It’s a direct measure of whether your expensive assets—be it machinery or people—are sitting idle.
Putting Metrics Into Context
To help you get started, here’s a quick breakdown of some common metrics, how to calculate them, and where they tend to be most useful.
Key Operational Efficiency Metrics and Their Applications
| Metric Name | How to Calculate It | What It Measures | Best For (Industry/Department) |
|---|---|---|---|
| Cycle Time | Total Time to Complete Process – Value-Added Time | The time spent on non-value-added activities within a process. | Manufacturing, Software Development |
| Throughput | (Total Units Produced) / (Total Time) | The rate at which a system generates products or services. | Production Lines, Fulfillment Centers |
| Capacity Utilization Rate | (Actual Output) / (Potential Output) x 100 | How much of your total production capacity is being used. | Manufacturing, Service-Based Businesses |
| First Contact Resolution (FCR) | (Issues Resolved on First Contact) / (Total Issues) x 100 | The percentage of customer issues resolved in a single interaction. | Customer Support, Help Desks |
| Operating Margin | (Operating Income / Revenue) x 100 | The profitability of core business operations before interest and taxes. | All Industries (Finance, Executive) |
| Cost Per Unit | Total Production Costs / Total Units Produced | The cost to produce a single item or deliver a single service. | Manufacturing, SaaS, Logistics |
Choosing the right combination of these metrics is what gives you a complete operational dashboard, not just a few disconnected numbers.
My two cents: Picking the right metrics is like finding the vital signs for your business. A good set of KPIs doesn't just tell you what's happening—it helps you understand why, guiding you toward smarter, more impactful decisions.
The metrics you choose have to fit your specific operation. If you run a logistics-heavy business, you'll want to get familiar with key warehouse efficiency metrics.
On the other hand, for a service-oriented team, a totally different set of numbers will matter. You can check out our detailed guide on customer support metrics for ideas on how to measure the efficiency of your service delivery. Nailing this mix is the secret to avoiding data overload while still getting a full view of what's going on.
How to Gather and Analyze Performance Data

The best metrics in the world won't help you if the data behind them is unreliable. Thankfully, you don't need to build a complicated new system to get the information you need. The trick is to tap into the tools and workflows you already have in place.
Chances are, a goldmine of performance data is sitting right inside your existing software. Think about your CRM, ERP system, or even project management apps like Asana or Jira. These platforms are constantly logging timestamps, tracking tasks, and recording customer interactions—all perfect ingredients for your efficiency metrics.
Key Insight: The goal is to make data collection a natural byproduct of your team's everyday work, not another task on their to-do list. Automate it wherever you can.
By pulling data automatically, you avoid the tedious and error-prone process of manual tracking. Clean, consistent data is the foundation for any meaningful analysis.
Tapping Into Your Existing Tools
First things first, figure out where the data for your key metrics actually lives. If you’re measuring First Contact Resolution (FCR), your helpdesk software holds the answers. If you’re tracking Cycle Time for a new feature, your project management tool is the source of truth.
To really get a handle on this, you'll want solid reporting capabilities. Modern systems with improved dashboard reporting tools, for example, can make a huge difference. Many of these platforms have built-in dashboards or connect easily with business intelligence (BI) tools to bring all your data into a single, coherent view.
Here are a few common places to find the data you need:
- Helpdesk Software: Gives you ticket volume, resolution times, and customer satisfaction scores.
- CRM System: Holds the details on sales cycles, customer lifetime value, and lead conversion rates.
- Project Management Tools: Tracks task durations, project timelines, and who is working on what.
- Financial Software: Provides the hard numbers on labor costs, operating expenses, and revenue.
Turning Raw Data Into Actionable Insights
With your data in hand, it's time to find the story it's telling. This isn't about complex data science; it's about spotting patterns that you can act on.
A great place to start is simple trend analysis. Just plot your main metric over time—say, week by week or month by month. Is performance getting better, worse, or just staying flat? You might notice efficiency dips every Friday afternoon, which could point to a recurring bottleneck right before the weekend.
Benchmarking is another powerful move. Compare your current numbers to your own past performance to see how much you've improved. If you can get your hands on industry benchmarks, even better. This gives you crucial context. A 90% resolution rate sounds great, but if the industry average is 95%, you know you still have work to do. The whole point is to find patterns that lead to real, tangible changes.
Using Technology and AI to Measure Smarter
Let's be honest: manual data collection and wrestling with spreadsheets can only get you so far. If you're serious about measuring operational efficiency, you have to bring in the right technology to automate and sharpen your tracking. The best tools don't just collect data—they turn it into clear, real-time insights you can actually use.
Business Intelligence (BI) platforms are a great place to start. Tools like Tableau or Microsoft Power BI are designed to connect directly to the places you already work, like your CRM, project management software, and financial systems. They automatically pull that information together and display your most important KPIs on dynamic dashboards.
Imagine seeing your cycle time or defect rate update live instead of waiting for a month-end report. This kind of real-time visibility is what allows you to shift from being reactive to proactive. You no longer have to guess where a bottleneck is forming; you can see it building on a chart long before it grinds your entire workflow to a halt.
The Game-Changing Role of Artificial Intelligence
While BI dashboards are fantastic for showing you what's happening right now, Artificial Intelligence (AI) pushes that a step further by helping you understand what's likely to happen next—and why. AI is fundamentally changing the efficiency game by spotting patterns and connections that are simply invisible to the human eye.
The growth of AI in business is staggering. Its annual growth rate is projected at 36.6% between 2024 and 2030, and we can expect adoption to hit 72% of companies by 2025. In fact, 92.1% of businesses are already seeing real, measurable performance boosts from AI. These aren't small gains, either; they're expected to lift local GDP by up to 26% by 2030. You can dig into more of these fascinating trends in the full AI insights at Superhuman.com.
So, what does this mean for measuring efficiency? It means you can get to the root of a problem much faster. AI algorithms can sift through millions of data points to pinpoint the cause of a slowdown, a task that might take a team of analysts weeks to complete manually.
Here are a few ways this plays out in the real world:
- Predictive Maintenance: In manufacturing, AI can analyze data from equipment to predict when a machine is likely to fail. This allows you to schedule maintenance before a costly breakdown brings production to a standstill.
- Process Mining: AI tools can map your actual business processes by analyzing digital footprints in your software. This reveals where work truly deviates from the plan, highlighting hidden delays and workarounds.
- Automated Root Cause Analysis: If a key metric like customer satisfaction suddenly drops, AI can instantly analyze support tickets, product reviews, and social media chatter to identify the most likely cause.
Expert Tip: Don't think of AI as a replacement for your team. See it as a powerful assistant. It handles the heavy-lifting of data analysis, freeing up your people to focus on what they do best: making smart, strategic decisions based on much deeper insights.
By weaving these technologies into your operations, you can finally move beyond just measuring efficiency and start actively optimizing it with data-driven precision.
Turning Measurement Into Lasting Improvement
Okay, you’ve gathered the data and analyzed the metrics. Now what? This is the part where the real work—and the real value—begins. Numbers on a dashboard are useless until you turn them into concrete, lasting improvements. It's time to close the loop and transform those insights into a solid action plan that actually drives change.
The goal isn't just to patch up a few problems. It’s about building a culture where getting better is a continuous, natural part of how your team operates. We're talking about making small, smart adjustments consistently over time.
This proactive mindset is more important than ever. The global economy is experiencing a "productivity plateau," with sluggish growth and some G7 nations even seeing negative labor productivity. Old methods are hitting a wall. To stay competitive, leaders have to dig into the metrics to find fresh, innovative ways to boost efficiency.
Create a Clear Action Plan
Your first move? Translate your findings into a simple, prioritized to-do list. Remember, not all improvements are created equal. You need to focus on what gives you the biggest bang for your buck. Look for the quick wins—the changes that offer the most impact for the least amount of effort.
For example, if your data shows that a technician spends 30% of their day on manual data entry, automating that task is a huge win. It’s high-impact and relatively low-effort. On the other hand, a complete overhaul of a legacy software system is also high-impact, but it's a massive undertaking. That's a long-term project, not a quick win.
My Tip: How you frame your findings matters. Instead of saying, "Our cycle time is way too long," try something like, "We have a great opportunity to speed up our delivery by tackling this one bottleneck." This simple shift in language turns criticism into a collaborative challenge and gets people on board.
Introduce a Framework for Change
To make your improvements stick, you need a system. The Plan-Do-Check-Act (PDCA) cycle is a fantastic, straightforward framework for testing changes in a controlled way without causing chaos.
Here’s how it works:
- Plan: Pinpoint an opportunity and map out a change. For instance: "Let's create three new email templates to handle our most common support questions."
- Do: Roll out the change on a small scale. "We'll have two agents use the new templates for one week to see how it goes."
- Check: Analyze the results. "Did First Contact Resolution (FCR) improve for those agents? Did their average handle time go down?"
- Act: If the test was a success, implement the change across the team. If not, figure out what you learned and start the cycle over with a new plan.
This iterative process minimizes risk and helps you learn what really works for your specific team and workflow.
Foster a Culture of Continuous Improvement
Lasting change isn't a top-down order; it's a team sport. Be transparent. Share your findings and your action plan with everyone involved. When people understand the "why" behind a change, they're far more likely to embrace it and even contribute their own ideas.
This is especially true in service departments, where even small tweaks can have a massive ripple effect on customer satisfaction. For teams focused on refining their service delivery, our guide on https://blog.screendesk.io/help-desk-optimization/ offers practical strategies that fit perfectly with this improvement cycle.
Once you've measured your processes, it's time for implementation. For more immediate results, you can check out these effective tips to improve workflow efficiency. By making measurement and improvement a transparent, collaborative process, you empower your team to take ownership of their efficiency and constantly look for ways to get better.
Common Questions About Operational Efficiency
As you start digging into operational efficiency, you'll inevitably run into a few common questions. It's one thing to grasp the theory, but putting it all into practice in the real world is where things can get a little tricky. Let's tackle some of the questions I hear most often and give you some straight answers to get you moving.
How Often Should I Measure Efficiency?
This is a big one, and the honest answer is: it depends. There’s no magic number. The right frequency really comes down to the metric you're tracking and the natural pace of your business. The trick is to match your measurement cadence to the speed of the operation you're measuring.
For fast-moving parts of your business, you'll want to check in more often:
- Daily or Weekly: This works perfectly for metrics like production output, support ticket volume, or daily sales figures. Tracking these frequently helps you catch problems right away, before they have a chance to grow into something bigger.
- Monthly or Quarterly: This is a better fit for the bigger picture stuff—think operating margin, overall employee productivity, or customer lifetime value. These metrics don't change dramatically day-to-day, so looking at them less often helps you spot meaningful trends instead of getting bogged down by daily noise.
Whatever you choose, the key is consistency. Sticking to a regular rhythm is what helps you tell the difference between a one-off fluke and a genuine trend that needs your attention.
What's the Difference Between Efficiency and Productivity?
People often use these terms as if they mean the same thing, but they’re measuring two completely different—though related—concepts. Getting this distinction right is fundamental to setting goals that actually make sense.
Productivity is all about volume. It’s purely a measure of how much you produce. A team that processes 100 orders in a day is, by definition, more productive than a team that processes 80.
Efficiency, however, is about resources. It looks at the inputs required to get that output. It asks, "How much time, money, or effort did we spend to process each of those 100 orders?"
You can be highly productive but wildly inefficient. Think of a factory churning out thousands of widgets (high productivity) but burning through expensive materials and creating tons of waste to do it (low efficiency). The goal isn't just to do more, but to do more with less. That's the sweet spot.
Where Should a Small Business Start?
If you’re just getting your feet wet, the biggest mistake you can make is trying to track everything at once. It’s tempting to build a giant dashboard with twenty different KPIs, but you'll just end up overwhelmed.
Keep it simple. Start small.
Pick just one or two metrics that are directly tied to your biggest costs or your customer experience. Find one process where you have a gut feeling that things could be smoother.
Here are a couple of solid starting points:
- Measure a core process cycle time. How long does it take to get a customer's order out the door from the moment they click "buy"? This single metric can shine a light on bottlenecks you didn't even know you had.
- Track your cost of goods sold (COGS) as a percentage of revenue. This is a classic for a reason. It's a straightforward financial metric that tells you how efficiently you're creating the very thing you sell.
Get really good at tracking and understanding these first. Once you have a handle on collecting the data, analyzing it, and actually making changes based on what you find, then you can start layering in more metrics.
Ready to stop wasting time on back-and-forth emails? Screendesk helps you solve customer issues faster with integrated video recordings and live calls, right from your helpdesk. See how Screendesk can boost your support efficiency.