
Delivering exceptional customer service isn't about guesswork; it's about data. To truly understand and improve your team's effectiveness, you need to track the right customer support performance metrics. These key performance indicators (KPIs) transform abstract goals like "happier customers" into concrete, measurable targets. They provide a clear view of your team's strengths and weaknesses, enabling you to make informed decisions that directly impact customer loyalty and business growth. Without these metrics, you're flying blind, unable to pinpoint what’s working, what’s broken, and where your resources are best spent.
This guide moves beyond generic definitions. We will explore the most critical metrics for any modern support team, from established benchmarks to emerging best practices. You'll learn not only what to measure but how to measure it effectively and, most importantly, what to do with the data you collect. We will provide actionable strategies, real-world examples, and specific implementation details for each KPI, including:
- First Contact Resolution (FCR)
- Customer Satisfaction Score (CSAT)
- Average Response Time
- Net Promoter Score (NPS)
- Average Handle Time (AHT)
- Ticket Volume and Backlog
- Customer Effort Score (CES)
- Resolution Time
By mastering these customer support performance metrics, you can build a more efficient, effective, and customer-centric support operation.
1. First Contact Resolution (FCR)
First Contact Resolution, or FCR, is a critical customer support performance metric that tracks the percentage of customer issues resolved entirely within the first interaction. This means the customer does not need to call back, email again, or open a new chat session for the same problem. FCR is a powerful indicator of both customer satisfaction and operational efficiency; when it's high, customers are happy, and your team is performing effectively.

A high FCR rate directly correlates to a better customer experience. Resolving an issue on the first try saves the customer valuable time and effort, reducing their frustration and building trust in your brand. It also significantly cuts down on operational costs by minimizing the volume of repeat contacts, freeing up agents to handle new inquiries.
How to Improve Your FCR Rate
Boosting your FCR involves empowering your agents and refining your internal processes. Success stories like Zappos, known for its legendary customer service, show the value of giving agents unlimited time and authority to solve a customer's problem completely.
Here are actionable steps to improve this key metric:
- Invest in Knowledge Management: Create and maintain a comprehensive, easily searchable internal knowledge base. When agents can find accurate information quickly, they can resolve issues faster without needing to escalate or ask a colleague.
- Empower Your Agents: Give your support team the authority to make decisions, such as processing refunds or offering credits, without needing a manager's approval. This autonomy, a cornerstone of Amazon's support strategy, eliminates delays and resolves issues on the spot.
- Implement Robust Tracking: Use your help desk software to accurately track tickets and identify repeat contacts from the same customer about the same issue. Analyzing these instances helps you pinpoint root causes, whether they are product flaws, process gaps, or training needs.
- Verify Resolution with Surveys: Send a simple, automated survey 24-48 hours after an interaction asking, "Was your issue resolved?" This confirms the customer's perspective on resolution, providing a more accurate FCR measurement than just relying on an agent closing a ticket.
2. Customer Satisfaction Score (CSAT)
Customer Satisfaction Score, or CSAT, is one of the most direct customer support performance metrics, gauging how happy customers are with a specific support interaction. It's typically measured with a simple, post-interaction survey asking, "How satisfied were you with the support you received?" on a scale of 1-5 or 1-10. CSAT gives you a real-time pulse on your service quality directly from the customer's perspective.

A high CSAT score indicates that your agents are effectively meeting customer expectations and delivering positive experiences. This transactional feedback is invaluable for pinpointing specific moments of success or failure in the customer journey. By tracking CSAT, you can quickly identify agents who excel, channels that perform well, and interactions that lead to dissatisfaction, allowing for immediate intervention and continuous improvement.
How to Improve Your CSAT Score
Improving your CSAT score involves making the feedback process seamless for the customer and acting on the insights you gather. Companies like Microsoft use a simple 1-5 scale after every support ticket to capture immediate sentiment, while HubSpot combines the score with open-ended questions to understand the "why" behind the rating.
Here are actionable steps to improve this key metric:
- Time Your Surveys Perfectly: Send your CSAT survey immediately after the support interaction concludes. The experience is still fresh in the customer's mind, leading to a higher response rate and more accurate feedback.
- Keep Surveys Short and Simple: Limit your survey to one or two essential questions. A long survey creates friction and can deter customers from responding. Focus on the core satisfaction question to maximize completion rates.
- Follow Up on Negative Feedback: Proactively reach out to customers who leave a low score. A personalized email or call to understand their issue and offer a resolution can turn a negative experience into a positive one and prevent churn.
- Analyze and Act on Data: Regularly review CSAT scores to identify trends. Use this data to inform agent training, update your knowledge base, or refine internal processes. For a deeper understanding, explore different ways of performing a Customer Satisfaction Score (CSAT) calculation on blog.screendesk.io.
3. Average Response Time
Average Response Time measures the typical duration it takes for a support agent to provide an initial reply to a customer inquiry. This vital customer support performance metric is a cornerstone of Service Level Agreements (SLAs) and directly shapes a customer's initial perception of your service quality. A swift first reply acknowledges the customer's issue and assures them that help is on the way, preventing frustration from escalating.
This metric is particularly powerful because it sets the tone for the entire customer interaction. A fast response, even if it's just to confirm receipt and set expectations, shows respect for the customer's time and improves their overall experience. Companies like Intercom excel here, using smart routing to achieve sub-6 minute response times for live chat, demonstrating a commitment to immediate engagement.
The following bar chart illustrates how drastically expected response times can vary across different communication channels.
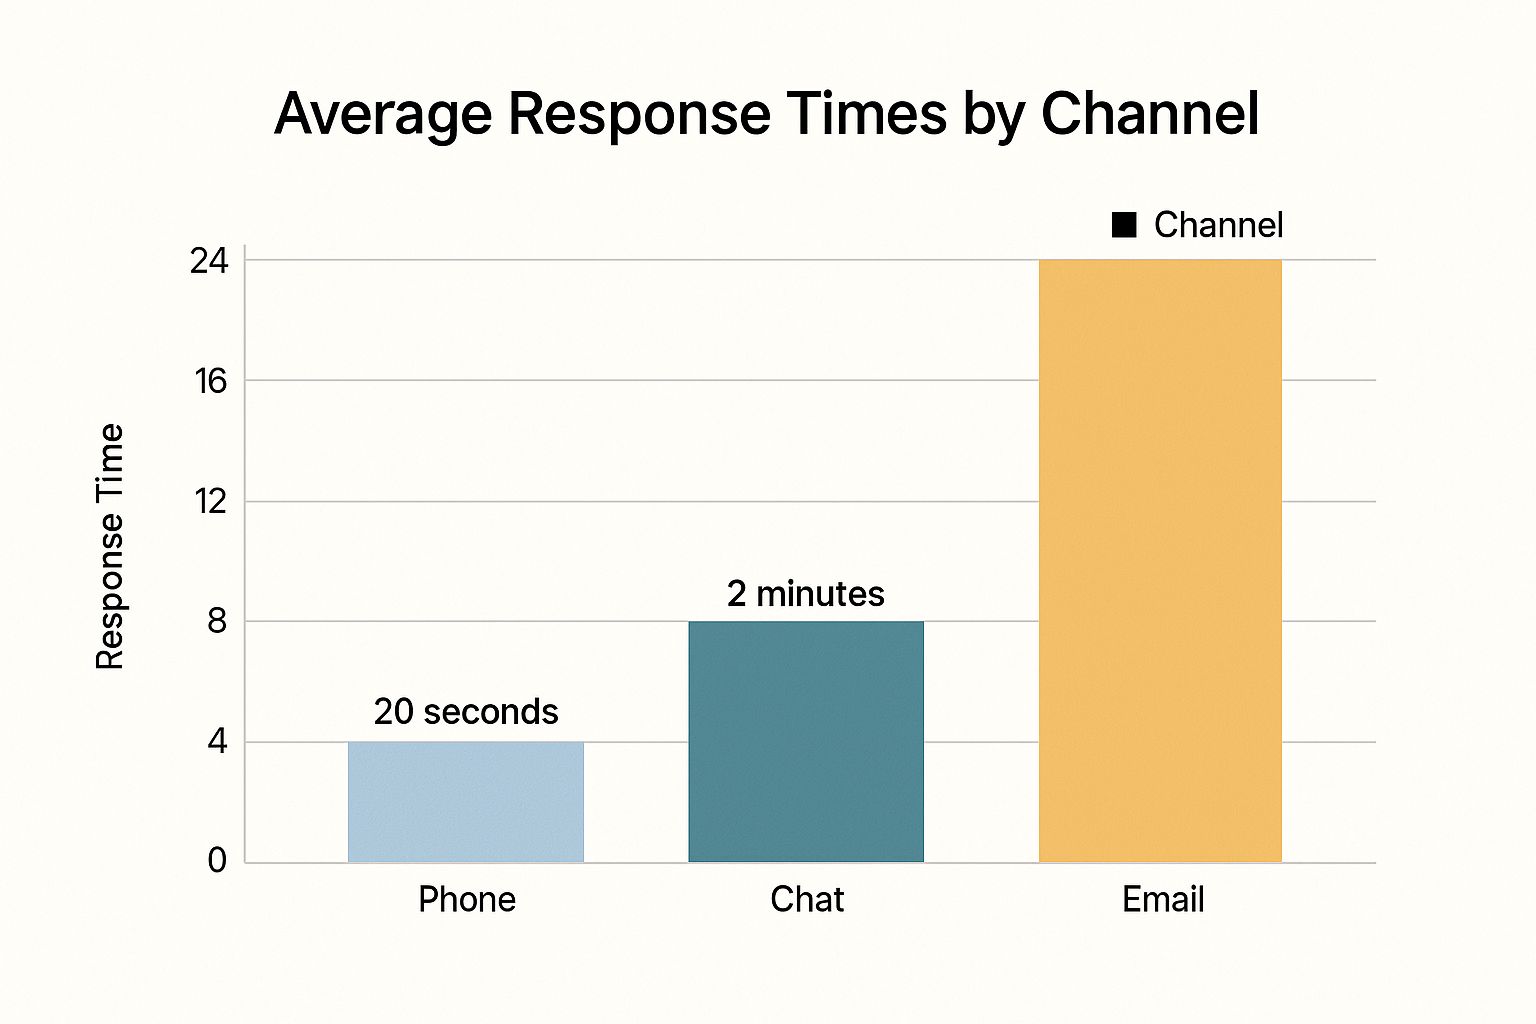
The chart highlights the immediacy expected from synchronous channels like phone and chat versus the patience customers typically have with asynchronous channels like email.
How to Improve Your Average Response Time
Improving this metric requires a strategic blend of automation, intelligent workflow management, and resource allocation. For instance, Buffer famously maintains a 1-hour email response time by implementing a "follow-the-sun" support model, ensuring agents are always available across different time zones.
Here are actionable steps to improve this key metric:
- Set Channel-Specific Goals: Establish realistic response time targets for each support channel. An acceptable response time for email (e.g., under 12 hours, as seen in Zendesk benchmarks) is vastly different from chat, where customers expect a reply within minutes.
- Use Automated Acknowledgments: For asynchronous channels like email or support tickets, implement an automated reply that instantly confirms receipt. This message should thank the customer, provide their ticket number, and set a clear expectation for when they can expect a human response.
- Implement Intelligent Routing: Configure your help desk to automatically route incoming inquiries to the agent or team best equipped to handle them. Routing based on skill, language, or issue type bypasses manual triage and connects customers with the right expert faster.
- Monitor and Adjust Staffing: Continuously track your response times by channel and time of day. This data will reveal peak periods, allowing you to adjust staffing schedules to meet demand and ensure you consistently hit your targets. To dive deeper, you can learn more about improving response time on blog.screendesk.io.
4. Net Promoter Score (NPS)
Net Promoter Score, or NPS, is a widely used customer support performance metric that measures long-term customer loyalty and their likelihood to recommend your brand. It’s based on a single, powerful question: "On a scale of 0-10, how likely are you to recommend our company/service to a friend or colleague?" This metric, popularized by Fred Reichheld and Bain & Company, provides a clear, high-level view of customer sentiment.
Based on their responses, customers are categorized as Promoters (score 9-10), Passives (7-8), or Detractors (0-6). The final NPS score is calculated by subtracting the percentage of Detractors from the percentage of Promoters. A positive score is good, while a score above 50 is excellent. Companies like Apple, which consistently achieves NPS scores above 70 for its support, demonstrate a powerful link between great service and brand advocacy.
How to Improve Your NPS
Improving your NPS means focusing on creating more Promoters and actively addressing the concerns of Detractors. Success stories like Tesla show how targeted service improvements, such as introducing mobile service technicians, can dramatically lift an NPS from negative to positive territory by directly resolving customer pain points.
Here are actionable steps to improve this key metric:
- Ask Follow-Up Questions: Always include an open-ended follow-up question like, "What is the primary reason for your score?" This qualitative feedback is crucial for understanding the "why" behind the numbers and provides actionable insights for improvement.
- Segment Your Data: Don't just look at the overall score. Segment NPS results by customer demographics, product lines, or support channels. This helps you identify specific areas of strength and weakness within your customer experience.
- Close the Loop: Implement a "close the loop" process where a team member personally contacts Detractors to understand their issues and offer a resolution. This proactive outreach can turn a negative experience into a positive one and prevent churn. Ritz-Carlton excels at this by using NPS feedback to ensure service quality is maintained at every touchpoint.
- Track Trends Over Time: Focus on the trend of your NPS score rather than a single, static number. Monitoring the score over months and quarters helps you understand the real impact of your improvement initiatives and seasonal changes in customer sentiment.
5. Average Handle Time (AHT)
Average Handle Time, or AHT, is a core customer support performance metric measuring the average duration of a single customer interaction. It encompasses the entire process from the moment a customer initiates contact until the agent finishes all related after-call work (ACW). AHT includes total talk time, all hold times, and any wrap-up tasks like logging notes or sending follow-up emails. It's a fundamental efficiency metric used for staffing, forecasting, and budgeting.

While a lower AHT can indicate operational efficiency, focusing on it exclusively is dangerous. Pressuring agents to shorten calls can lead to rushed service, unresolved issues, and poor customer satisfaction. Instead, AHT should be used to understand resource allocation and identify process bottlenecks. For example, a company like American Express uses AHT data to optimize staffing levels for peak call times, ensuring they have enough agents available without overstaffing.
How to Optimize Your AHT
Improving AHT is about becoming more effective, not just faster. Success stories like Southwest Airlines show the value of empowering agents to take the time needed to deliver quality service, balancing efficiency with satisfaction. The goal is to remove roadblocks and streamline workflows, not to rush human interaction.
Here are actionable steps to manage this key metric:
- Balance AHT with Quality Metrics: Never track AHT in isolation. Always analyze it alongside Customer Satisfaction (CSAT) and First Contact Resolution (FCR). A drop in AHT accompanied by a drop in CSAT is a major red flag, indicating that quality is being sacrificed for speed.
- Provide In-Depth Training: Equip agents with deep product knowledge and system training. When they are confident and knowledgeable, they spend less time searching for answers or escalating issues, which naturally reduces handle time without compromising service quality.
- Use AHT for Planning, Not Punishment: Use AHT trends for strategic purposes like forecasting call volume and scheduling staff. Avoid using it as a primary metric for individual performance reviews, which can encourage agents to game the system and deliver poor service.
- Segment AHT by Issue Type: Not all issues are created equal. A simple password reset will have a much lower AHT than a complex technical troubleshooting session. Segmenting AHT by issue type, like T-Mobile does, allows you to set realistic benchmarks and identify specific areas for process improvement.
6. Ticket Volume and Backlog
Ticket Volume and Backlog are two foundational customer support performance metrics that provide a clear view of your operational health. Ticket Volume measures the total number of support requests received over a period, while the Backlog tracks the number of unresolved tickets accumulating over time. Monitoring these metrics together reveals vital insights into support demand, team capacity, and overall efficiency.
Tracking these figures helps you understand workflow patterns and resource allocation. A sudden spike in volume might signal a product outage or a confusing new feature, while a steadily growing backlog indicates your team is understaffed or inefficient. Companies like Shopify use this data to staff appropriately for peak seasons, ensuring they can manage high volume without compromising service quality. Similarly, Spotify analyzes ticket volume by feature to pinpoint areas of the user experience that need improvement.
How to Manage Your Ticket Volume and Backlog
Effectively managing volume and backlog involves proactive resource planning and process optimization. It’s about more than just counting tickets; it’s about understanding the story the numbers tell. Atlassian, for example, analyzes historical ticket data to forecast support demand for new product launches, allowing them to prepare their teams in advance.
Here are actionable steps to manage these crucial metrics:
- Implement Automated Ticket Tagging: Use AI and rule-based automation in your help desk to automatically categorize and route incoming tickets. This provides clean data for volume analysis by topic, urgency, or product area, helping you identify trends faster.
- Use Historical Data for Forecasting: Analyze past ticket volume trends (daily, weekly, and seasonal) to predict future demand. This allows you to create smarter staffing schedules, preventing your team from being overwhelmed during predictable spikes.
- Monitor Backlog Growth Rate: Instead of focusing only on the absolute number of backlogged tickets, track the growth rate. A rising rate is an early warning sign that your current capacity cannot meet demand, prompting you to investigate the root cause before it becomes unmanageable.
- Combine Volume with Quality Metrics: A low backlog isn't always positive if agents are rushing and providing poor-quality answers. Correlate volume and backlog data with metrics like CSAT or FCR to ensure that efficiency gains don't come at the expense of customer satisfaction.
7. Customer Effort Score (CES)
Customer Effort Score, or CES, is a powerful customer support performance metric that measures the ease of a customer's experience when resolving an issue. Popularized by Matthew Dixon in his book The Effortless Experience, its core principle is that loyalty is driven by reducing customer effort, not by delighting them. CES asks customers to rate how easy it was to get their problem solved, often on a scale of 1 (very difficult) to 7 (very easy).
A low-effort experience is a strong predictor of customer retention and repurchase behavior. When it's easy for customers to get help, they are less likely to churn and more likely to speak positively about your brand. Tracking CES helps you pinpoint and eliminate friction in your support processes, creating smoother customer journeys. For instance, Google uses CES to refine its self-service portals, ensuring users can find answers with minimal struggle.
How to Improve Your CES
Improving your Customer Effort Score means systemically removing obstacles from the customer’s path. The goal is to make problem resolution feel seamless and intuitive. Companies like Uber and Airbnb rely heavily on CES to streamline interactions for both sides of their marketplaces, from drivers and riders to hosts and guests.
Here are actionable steps to improve this key metric:
- Map and Analyze the Customer Journey: Identify every touchpoint a customer has when seeking support. Use CES surveys at key stages to pinpoint where effort is highest, such as navigating a complex IVR system or finding a contact form on your website.
- Focus on Process, Not People: Use CES feedback to identify and fix flawed processes rather than blaming individual agents. A high-effort score often points to systemic issues like inadequate tools, poor knowledge base articles, or restrictive policies that agents cannot bypass.
- Empower Self-Service Options: Invest in clear, comprehensive, and easily searchable help centers and FAQs. A customer who can solve their own problem without contacting you experiences the ultimate low-effort interaction.
- Combine with Other Metrics: Analyze CES alongside FCR and CSAT for a complete picture. A customer might be satisfied (CSAT) but still have expended a lot of effort, which CES will reveal. This combination provides deeper insight into the quality of your support.
8. Resolution Time
Resolution Time, also known as Mean Time to Resolution (MTTR), is one of the most vital customer support performance metrics. It measures the total duration from when a customer first creates a support ticket until that ticket is marked as fully resolved. Unlike metrics that track initial responses, Resolution Time captures the entire lifecycle of a customer issue, offering a true measure of your support process's overall efficiency. From the customer's point of view, this is often the metric that matters most.
A shorter Resolution Time is a powerful driver of customer satisfaction and loyalty. When issues are solved quickly, it demonstrates respect for the customer's time and reinforces their confidence in your brand's ability to deliver. For the business, efficient resolution reduces agent workload on lingering tickets, minimizes customer frustration, and prevents minor issues from escalating into major problems. For more detail, you can explore the nuances of Time to Resolution on blog.screendesk.io.
How to Improve Your Resolution Time
Reducing your Resolution Time requires a strategic approach that balances speed with quality. Companies like Dropbox excel by setting different resolution time SLAs based on customer plan levels, ensuring high-priority users get faster service.
Here are actionable steps to improve this key metric:
- Set Realistic, Segmented Targets: Analyze historical data to establish baseline resolution times. Avoid a one-size-fits-all goal; instead, set different targets based on issue complexity, priority level, or product. Adobe, for example, segments its targets by product complexity and customer tier.
- Isolate Agent vs. Customer Time: Configure your help desk to pause the resolution clock when you are waiting for a customer response. This gives you a more accurate measurement of your team's internal efficiency, separating it from delays outside your control.
- Identify and Address Bottlenecks: Regularly analyze tickets with the longest resolution times. These outliers often reveal hidden process gaps, needs for better internal tools, or areas where agents require more training or authority to act.
- Prioritize Quality Over Hasty Closures: Emphasize that the goal is a complete and accurate resolution, not just a fast one. Rushing to close a ticket prematurely often leads to it being reopened, which ultimately hurts both the customer experience and your overall resolution time metrics.
Customer Support Metrics Comparison
| Metric | Implementation Complexity 🔄 | Resource Requirements ⚡ | Expected Outcomes 📊 | Ideal Use Cases 💡 | Key Advantages ⭐ |
|---|---|---|---|---|---|
| First Contact Resolution (FCR) | Medium to High: needs robust tracking and clear definitions | Moderate: agent training and knowledge management systems | High customer satisfaction, reduced repeat contacts | Customer support aiming for quality resolution | Strong correlation with satisfaction and loyalty |
| Customer Satisfaction Score (CSAT) | Low: simple surveys post-interaction | Low: survey tools and feedback channels | Immediate feedback on service quality | Measuring satisfaction per interaction | Easy to implement, direct customer feedback |
| Average Response Time | Low to Medium: varies by channel and routing | Moderate: monitoring tools and staffing | Timely initial customer contact, expectation management | Real-time and asynchronous communication channels | Impacts satisfaction, helps resource planning |
| Net Promoter Score (NPS) | Low: single-question standardized survey | Low: survey systems | Customer loyalty tracking and business growth prediction | Measuring long-term loyalty and advocacy | Simple, standardized, strong growth correlation |
| Average Handle Time (AHT) | Medium: requires detailed call tracking | Moderate: call analytics and staffing | Insights into efficiency and resource use | Operational efficiency and workforce planning | Helps identify training needs and cost accuracy |
| Ticket Volume and Backlog | Medium: integrated ticketing and tracking | Moderate: data analysis and classification | Demand forecasting and workload management | Capacity planning and service level monitoring | Early warnings on overload, resource allocation |
| Customer Effort Score (CES) | Low to Medium: tailored survey questions | Low: feedback collection tools | Identifies friction points, predicts loyalty | Process improvement and friction reduction | Strong predictor of loyalty, encourages simplification |
| Resolution Time | Medium to High: end-to-end ticket lifecycle monitoring | Moderate to High: system integration for SLA tracking | Complete view of issue resolution efficiency | SLA management and bottleneck identification | Reflects full customer experience and SLA compliance |
From Data to Delight: Activating Your Metrics for Superior Support
Navigating the landscape of customer support performance metrics can feel like translating a complex language. We've explored a powerful vocabulary, from the immediate feedback of First Contact Resolution (FCR) and Customer Satisfaction (CSAT) to the long-term loyalty insights offered by Net Promoter Score (NPS). Each metric, whether it measures speed like Average Response Time or effort like Customer Effort Score (CES), offers a unique lens through which to view your support operations.
The true power of these metrics, however, isn't found in isolation. A low Average Handle Time (AHT) is only a victory if it correlates with a high CSAT score. A growing ticket backlog becomes less alarming when you see a corresponding increase in resolved issues and positive customer feedback. The goal is not just to track numbers but to understand the stories they tell about your team's performance and your customers' experiences.
Key Takeaway: The most effective support teams don't just measure data; they weave it together to create a comprehensive, multi-dimensional view of their customer journey. This holistic perspective is what separates good support from truly exceptional service.
Your Action Plan for Metric-Driven Success
Mastering these customer support performance metrics is a continuous journey, not a final destination. To move from simply collecting data to actively improving outcomes, here are your immediate next steps:
- Establish Your Baseline: Before you can improve, you need to know where you stand. Choose three to four key metrics from this list that align most closely with your current business goals. Track them consistently for at least one quarter to establish a reliable baseline.
- Connect the Dots: Don't analyze metrics in a vacuum. Hold regular review meetings to discuss how different KPIs influence each other. For example, explore how a new training initiative aimed at reducing AHT might impact your FCR and CES scores. This practice uncovers deeper, more actionable insights.
- Empower Your Team: Share performance data transparently with your support agents. Frame metrics not as tools for scrutiny but as resources for professional growth and success. When agents understand the "why" behind the numbers, they become proactive partners in elevating the customer experience.
Ultimately, the purpose of tracking customer support performance metrics is to build a more efficient, empathetic, and effective support engine. By focusing on these key indicators, you transform raw data into a strategic asset. You gain the clarity needed to diagnose problems, celebrate wins, and consistently deliver the kind of service that turns satisfied customers into loyal advocates for your brand. This commitment to data-driven improvement is the cornerstone of building a support organization that not only solves problems but also creates genuine delight.
Ready to see these metrics in action with unparalleled clarity? Screendesk makes it effortless to capture the context behind every support ticket with instant, interactive screen recordings. Stop guessing and start seeing exactly what your customers see, helping your team slash resolution times and boost customer satisfaction. Try Screendesk for free and transform your support workflow today.