
Unlocking Help Desk Success: The Power of Metrics
Want a high-performing help desk? You need to track the right metrics. This listicle reveals seven key help desk metrics to monitor in 2025. Learn how tracking metrics like First Contact Resolution (FCR) and Customer Satisfaction Score (CSAT) can pinpoint areas for improvement, boost team efficiency, and enhance customer satisfaction. Using these help desk metrics provides valuable insights into your support operations, helping you optimize for peak performance and drive business growth.
1. First Contact Resolution (FCR)
First Contact Resolution (FCR) is a crucial help desk metric that measures the percentage of support tickets resolved during the customer's first interaction. This means the issue is completely addressed and the customer doesn't need to follow up with additional calls, emails, or chats. A high FCR demonstrates efficiency and directly correlates with customer satisfaction, as users appreciate swift and effective problem-solving. FCR is a key indicator of how well your help desk is performing and contributes significantly to a positive customer experience. It deserves a top spot in any list of essential help desk metrics due to its direct impact on both cost and customer happiness.

FCR is typically expressed as a percentage. It’s calculated by dividing the number of tickets resolved on the first contact by the total number of tickets received. This metric is often tracked across different communication channels like phone, email, and chat, allowing businesses to pinpoint areas for improvement within each channel. For example, you might find your email FCR is significantly lower than your phone FCR, highlighting a potential need for better email templates or training.
Features and Benefits:
- Percentage-based: Easy to understand and track progress.
- Direct correlation with customer satisfaction: Higher FCR generally leads to happier customers.
- Channel-specific tracking: Identify strengths and weaknesses in different communication methods.
- Reduces cost per ticket: Fewer interactions mean lower operational costs.
- Decreases total ticket volume: Effective first contact resolution prevents recurring issues and follow-up inquiries.
Pros:
- Strong indicator of help desk effectiveness.
- Reduces overall cost per ticket.
- Improves customer experience.
- Decreases total ticket volume.
Cons:
- Some complex issues inherently cannot be resolved on first contact.
- May encourage agents to provide incomplete solutions just to close tickets quickly.
- Different definitions of 'resolution' can affect accurate measurement.
- Needs to be balanced with quality measures to ensure resolutions are thorough and effective.
Examples of Successful Implementation:
- Zendesk reports that companies with FCR rates above 90% typically see 30-50% higher customer satisfaction.
- Apple's Genius Bar tech support maintains high FCR rates by having well-trained staff and specialized tools readily available.
- IBM's help desk improved FCR from 65% to 84% by implementing better knowledge management systems, empowering agents with the information they needed to resolve issues quickly.
Tips for Improving FCR:
- Develop comprehensive knowledge bases: Equip your agents with easily accessible information to quickly find solutions.
- Empower agents with authority: Allow agents to resolve common issues without needing escalation, speeding up the resolution process.
- Use call recording and quality monitoring: Identify areas for improvement in agent performance and training.
- Consider FCR alongside quality metrics: Don't prioritize speed over accuracy. Ensure resolutions are complete and effective.
- Measure FCR across different issue types and channels: Understand where your strengths and weaknesses lie to target specific improvements.
Popularized By:
- HDI (Help Desk Institute)
- ITIL (Information Technology Infrastructure Library) framework
- Gartner's IT service management research
When and why should you use this approach? FCR is a vital metric for any organization with a customer support function. Tracking and improving your FCR can lead to significant gains in customer satisfaction, cost savings, and overall help desk efficiency. Use FCR to benchmark your performance, identify areas for improvement, and ultimately provide a better customer experience.
2. Average Response Time
Average Response Time (ART) is a crucial help desk metric that measures how long it takes for a customer to receive an initial response after submitting a request. This doesn't measure the time to full resolution, but rather the time to first contact from a support agent acknowledging the issue. It's a key indicator of your help desk's responsiveness and availability, directly influencing how customers perceive the quality of your service. A slow response can lead to frustration and a negative impression, while a swift acknowledgment can reassure customers that their issue is being addressed. This metric is especially important for urgent issues where a quick response can significantly improve user experience and potentially mitigate further problems. This makes ART a deserving metric in any help desk evaluation.

ART is typically measured in minutes, hours, or even days, depending on the established service level agreements (SLAs). It's often differentiated based on the severity or priority level of the issue. For example, a critical system outage would have a much shorter target response time than a general inquiry. It's also important to track ART per channel (phone, email, chat, social media, etc.) as customer expectations and typical response times vary across different communication methods. These measurements are then often compared against predefined SLAs to ensure adherence to service commitments.
Companies like Amazon, Microsoft, and Salesforce prioritize ART. Amazon strives for response times under one minute for phone support and 24 hours for email. Microsoft's Enterprise Support ties response times to severity levels, ranging from 15 minutes for critical issues to 2 hours for high-severity problems. Salesforce tailors response time guarantees based on the customer's subscription tier, with Premier Support offering responses within one hour for critical issues. These examples highlight how prioritizing ART, even in different ways, can significantly contribute to customer satisfaction.
While a valuable metric, ART has its limitations. A fast response doesn't guarantee a fast resolution. Focusing solely on ART can incentivize superficial initial responses just to meet the target, without truly addressing the underlying issue. Furthermore, ART can fluctuate based on factors like time of day, day of the week, and seasonal variations in request volume. Therefore, while ART offers valuable insight into initial responsiveness, it shouldn't be the sole indicator of overall service quality.
Here are some actionable tips to improve your Average Response Time:
- Set different response time targets by issue priority: Prioritize urgent requests and allocate resources accordingly.
- Implement automated acknowledgment systems: Send automatic email or SMS confirmations upon ticket submission to manage customer expectations.
- Use workforce management tools: Optimize staffing levels during peak hours to ensure adequate coverage and prompt responses.
- Make response time goals visible to the entire team: Foster a culture of responsiveness and accountability.
- Consider implementing chatbots: Provide immediate initial responses and gather preliminary information for human agents.
Learn more about Average Response Time to further enhance your help desk’s performance. By carefully monitoring and managing your ART, and considering its place within a broader suite of help desk metrics, you can significantly improve customer satisfaction and build stronger relationships.
3. Average Resolution Time
Average Resolution Time (ART) is a crucial help desk metric that measures the average time it takes to resolve a customer issue from the moment it's reported until it's completely fixed. This metric provides a valuable end-to-end view of your help desk's efficiency and directly impacts both user productivity and customer satisfaction. It reveals how long users are stalled waiting for solutions, impacting their ability to work effectively. Tracking ART is essential for optimizing your help desk operations and ensuring a smooth user experience. This makes it a vital component of any robust set of help desk metrics.
How it Works:
ART is calculated by taking the total time spent resolving all tickets within a given period and dividing it by the number of tickets resolved. This time typically includes all hands-on work and any waiting time involved, such as waiting for information from the user, vendor responses, or parts delivery. It's usually measured in hours or days and is often segmented by issue type, priority, or category for more granular analysis. For example, a "password reset" request should have a significantly lower ART than troubleshooting a complex network issue. This segmentation helps pinpoint specific areas needing improvement.
Benefits of Tracking ART:
- Comprehensive Efficiency Measurement: ART offers a holistic view of your help desk's performance, highlighting areas for improvement within the entire resolution process.
- Impact on Business Productivity: Faster resolution times translate directly to increased user productivity as employees can quickly return to their tasks.
- Improved Customer Satisfaction: Shorter wait times for solutions lead to happier customers and increased loyalty.
- Bottleneck Identification: By analyzing ART for different issue types and priorities, you can identify bottlenecks and optimize workflows.
- Informed Resource Allocation: ART data helps justify staffing decisions and allocate resources effectively.
Examples of Successful Implementation:
- Google Cloud Platform: Differentiates resolution time targets by priority, with critical (P1) issues targeted for resolution within 4 hours, illustrating the importance of prioritizing urgent issues.
- Bank of America: Reduced their IT help desk's ART from 36 hours to 18 hours by implementing a tiered support structure, demonstrating the effectiveness of this approach.
- Dell's ProSupport: Resolves 84% of severity 1 issues within 6 hours by using remote diagnostics tools, highlighting the impact of technology on improving resolution times.
Pros and Cons of Using ART:
Pros:
- Directly impacts business productivity and customer satisfaction
- Helps identify bottlenecks in the resolution process
- Provides insights for staffing and resource allocation
Cons:
- Can be skewed by outliers (very complex issues)
- May encourage rushing through solutions to improve metrics (at the expense of quality)
- Often affected by factors outside help desk control (vendor response, parts delivery)
- Doesn't directly account for the quality of the resolution
Actionable Tips for Improving ART:
- Categorize and Analyze: Break down resolution time by issue type and priority to identify specific problem areas.
- Knowledge is Power: Implement a robust knowledge management system to empower agents and users to quickly resolve common issues.
- Tiered Support: Consider a tiered support structure with escalation paths for complex issues to ensure they are handled by the right experts.
- Balance Speed and Quality: Track resolution time alongside customer satisfaction metrics to ensure quality isn't sacrificed for speed.
- Embrace Automation: Use automation and remote support tools where possible to streamline processes and reduce resolution times.
When and Why to Use ART:
ART should be a core metric for any help desk seeking to improve efficiency, customer satisfaction, and user productivity. It's particularly valuable for organizations with defined service level agreements (SLAs) as it allows them to track performance against these targets. Tracking ART provides insights into the effectiveness of your support processes and helps you identify areas for ongoing improvement. This metric is popularized by organizations like HDI (Help Desk Institute), the ITIL service management framework, and Gartner IT service metrics, solidifying its importance in the field of help desk management.
4. Customer Satisfaction Score (CSAT)
Customer Satisfaction Score (CSAT) is a key help desk metric that measures how satisfied users are with the service they received. It provides direct feedback on service quality from the user's perspective, allowing organizations to understand the effectiveness of their support efforts from the end-user viewpoint. This goes beyond simply measuring operational metrics like resolution time or ticket volume, offering invaluable insight into the actual customer experience. CSAT helps identify areas where support excels and where it needs improvement, directly impacting customer loyalty and retention.

CSAT is typically collected through surveys sent to users after a support interaction, usually immediately following ticket closure. These surveys often utilize a numerical scale (e.g., 1-5, 1-10, or a percentage) to gauge satisfaction levels. Many also include space for comments, providing valuable qualitative feedback alongside the quantitative score. For a more granular understanding, CSAT data can be broken down by agent, issue type, or department, highlighting specific areas of strength and weakness within the help desk. To effectively track trends and identify areas for ongoing improvement, CSAT should be measured consistently over time. Learn more about Customer Satisfaction Score (CSAT)
Features of CSAT:
- Usually measured on a scale (1-5, 1-10, or percentage)
- Collected via surveys sent after ticket closure
- Can be broken down by agent, issue type, or department
- Often includes comments or qualitative feedback
- Should be measured consistently over time to track trends
Pros of using CSAT:
- Provides direct feedback from users
- Highlights perception gaps between operational metrics and user experience
- Helps identify specific areas for improvement
- Can boost team morale when scores are positive
- Demonstrates commitment to user experience
Cons of using CSAT:
- Subject to response bias (extremely satisfied or dissatisfied users more likely to respond)
- Low response rates can skew results
- Users may rate based on issue outcome rather than service quality
- Cultural differences can affect scoring patterns
- Survey fatigue can reduce participation over time
Examples of Successful CSAT Implementation:
- Zappos consistently maintains CSAT scores above 95% by empowering support agents to go above and beyond standard procedures, prioritizing customer delight.
- American Express achieved a 10% increase in CSAT by implementing real-time feedback mechanisms, allowing for immediate address of customer concerns.
- Shopify’s help desk maintains 90%+ CSAT by focusing on personalization in customer interactions, creating a more positive and tailored support experience.
Tips for Effective CSAT Measurement:
- Keep surveys short and simple: This increases response rates and reduces user burden.
- Ask for feedback immediately after resolution: This captures the experience while it’s fresh in the user’s mind.
- Follow up on negative ratings: Understanding the root causes of dissatisfaction is crucial for improvement.
- Share CSAT results with the entire team regularly: Transparency fosters a culture of continuous improvement.
- Consider implementing rewards or recognition for high CSAT scores: This motivates agents and reinforces positive behavior.
- Use CSAT alongside other help desk metrics: This provides a more complete picture of help desk performance.
CSAT deserves a place in any list of essential help desk metrics because it provides the most direct line to understanding the customer's perception of your support service. By actively monitoring and improving CSAT, businesses can foster customer loyalty, reduce churn, and ultimately improve their bottom line.
5. Ticket Volume and Categorization
Ticket Volume and Categorization is a crucial help desk metric that tracks the influx of support tickets and segments them based on various criteria such as problem type, affected system, department, or other relevant categories. This provides invaluable insights into demand patterns, recurring issues, and resource allocation needs, ultimately allowing you to identify systemic problems and inform decisions related to staffing, training, and infrastructure improvements.
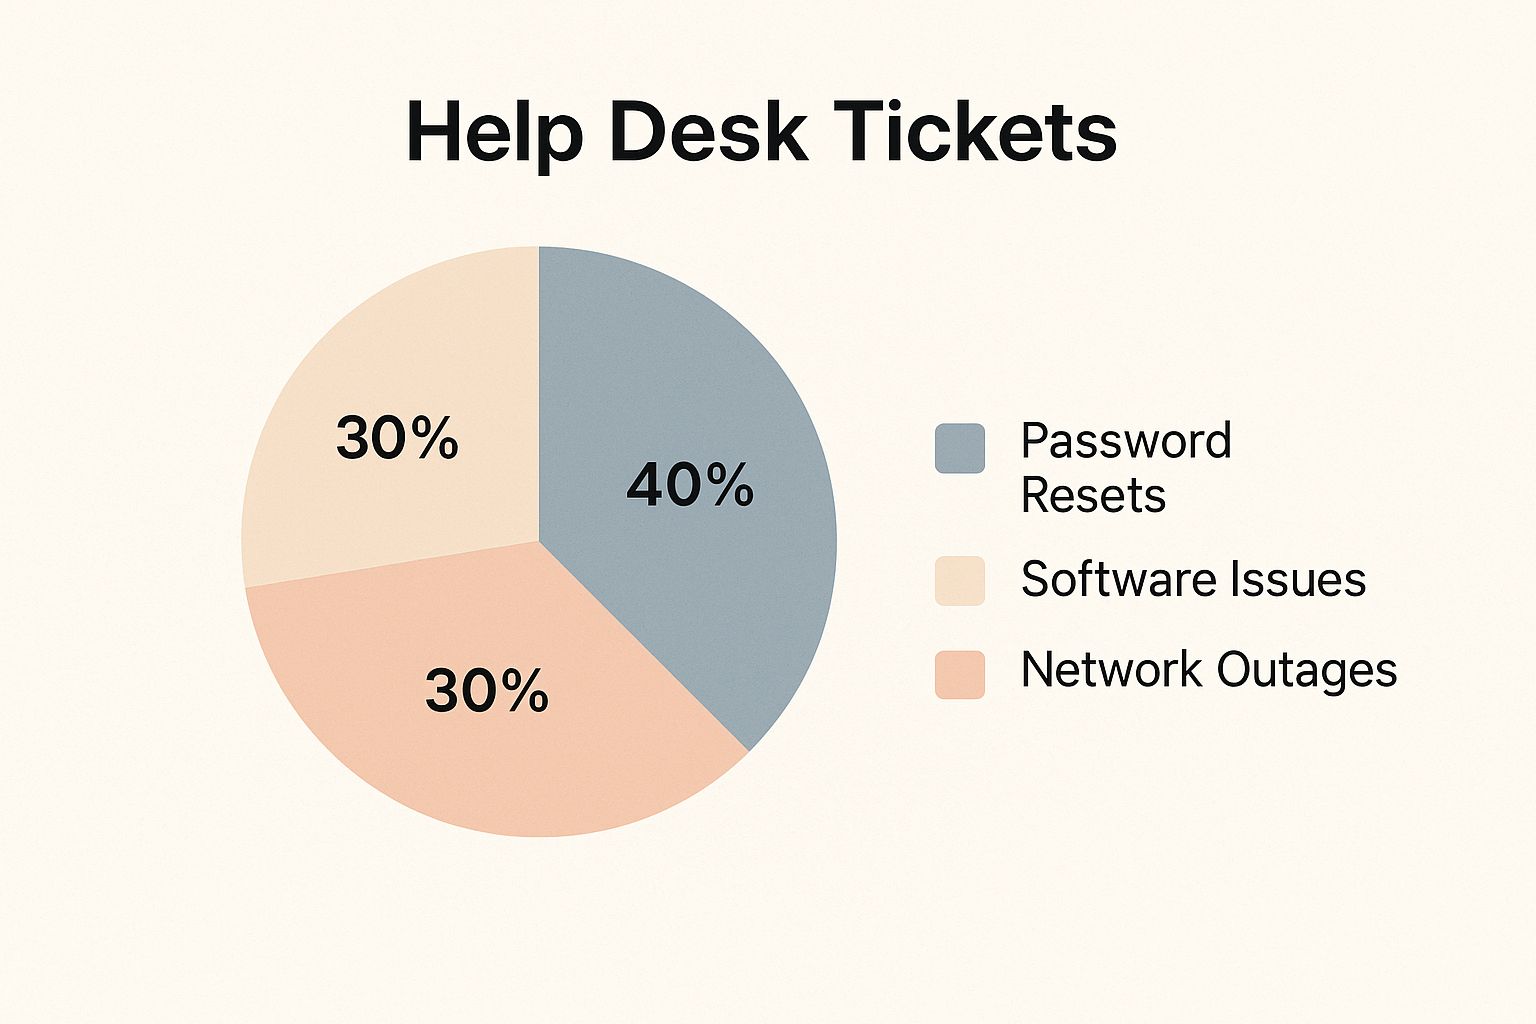
The infographic above visually represents the breakdown of ticket volume by category, highlighting the distribution of issues across different areas. As you can see, "Software Bugs" represent the largest portion of the tickets, followed by "Account Issues" and then "Hardware Problems". This visualization quickly pinpoints areas requiring immediate attention and resource allocation.
This method involves measuring the total number of tickets received over specific time periods (daily, weekly, monthly) and then categorizing them based on predefined criteria. This allows you to track patterns, including seasonal variations and sudden spikes in ticket volume. These insights can then be visualized through dashboards, offering a clear overview of ticket distributions and trends. This data is often integrated with root cause analysis processes to address underlying problems effectively.
This metric boasts several advantages. It helps identify systemic issues and recurring problems, enabling proactive problem management. By analyzing historical data, you can forecast future ticket volumes and plan resources accordingly. This data also informs knowledge base development priorities, allowing you to focus on creating content that addresses the most common issues. Furthermore, it facilitates targeted training initiatives by identifying areas where staff require additional expertise.
However, there are also potential drawbacks. Raw ticket numbers don't always reflect service quality. Inconsistent or overly complex categorization schemes can hinder accurate analysis. Maintaining precise categorization can require significant manual effort. External factors such as system releases or company growth can influence ticket volume, and the data requires proper context for accurate interpretation.
Real-world examples demonstrate the power of this metric. Microsoft IT used ticket volume analysis to identify that 40% of password reset requests came after holidays, leading to the implementation of self-service solutions. Adobe's support team leveraged categorization analysis to prioritize knowledge base articles, reducing related tickets by 25%. Spotify's help desk used ticket volume trends to identify and fix a recurring API issue that generated spikes every two weeks.
Here are some practical tips for effectively utilizing Ticket Volume and Categorization:
- Develop a clear, consistent categorization taxonomy: This ensures accurate tracking and reporting.
- Review and refine categories regularly: Your categories should evolve with your business and customer needs.
- Use ticket volume data to drive preventative measures: Identify recurring problems and implement solutions to prevent future occurrences.
- Correlate ticket volumes with business activities and system changes: This helps understand the impact of external factors on your support workload.
- Implement automated categorization where possible: This reduces manual effort and improves accuracy.
- Focus on the highest volume categories for improvement initiatives: Prioritize your efforts where they will have the greatest impact.
Tracking ticket volume and categorization is essential, but it's just one piece of the puzzle. To gain a deeper understanding of your project's performance, you need to consider other key project tracking metrics as outlined by Tooling Studio's guide on Top Project Tracking Metrics to Boost Your Success. This help desk metric deserves its place in the list because it provides a fundamental understanding of your support workload, helps identify areas for improvement, and contributes to a more efficient and effective support operation. By analyzing and acting upon this data, you can improve customer satisfaction, optimize resource allocation, and ultimately drive business success. This metric is popularized by frameworks like the ITIL Problem Management, HDI (Help Desk Institute) standards, and Jeff Rumburg's MetricNet benchmarking.
6. Cost per Ticket
Cost per Ticket is a crucial help desk metric that measures the average expense your organization incurs for resolving each support ticket. This metric provides valuable insight into the financial efficiency of your help desk operations and pinpoints areas where you can optimize costs without sacrificing service quality. Understanding and monitoring this metric is essential for any business looking to improve its bottom line and deliver excellent customer support. This makes Cost per Ticket a vital inclusion in any comprehensive list of help desk metrics.
How It Works:
Cost per Ticket is calculated by dividing the total help desk costs by the total number of tickets resolved within a specific period (e.g., monthly, quarterly, annually). These costs encompass both direct and indirect expenses:
- Direct Costs: Salaries of support staff, software licenses for help desk tools, hardware costs, and training expenses.
- Indirect Costs: A portion of facilities costs (rent, utilities), management overhead, and IT infrastructure expenses.
Features and Benefits:
- Comprehensive Cost Analysis: Includes all relevant expenses for a complete financial picture.
- Segmented Analysis: Can be broken down by ticket type (e.g., technical issue, billing inquiry), support channel (e.g., phone, email, chat), or complexity to identify specific cost drivers.
- Benchmarking: Allows comparison against industry standards and competitors to gauge performance.
- Financial Stewardship: Demonstrates responsible management of IT support resources.
- Budgeting and Resource Allocation: Supports data-driven decisions for future investments and resource allocation.
Why Use Cost per Ticket?
This metric is particularly valuable when:
- Evaluating the ROI of support investments: Justifying expenditures on automation, self-service portals, or new help desk software.
- Identifying cost-saving opportunities: Pinpointing inefficiencies in workflows, processes, or resource allocation.
- Improving operational efficiency: Streamlining support operations to reduce resolution times and costs.
- Negotiating with vendors: Leveraging benchmark data to secure better pricing on help desk tools and services.
Pros:
- Clear Financial Visibility: Provides a transparent view of support expenditures.
- Data-Driven Decision Making: Facilitates informed decisions about resource allocation and process improvements.
- Cost Optimization: Helps identify and eliminate unnecessary expenses.
Cons:
- Potential for Misinterpretation: Focusing solely on cost reduction can negatively impact service quality. It’s crucial to balance cost efficiency with customer satisfaction.
- Calculation Complexity: Accurately allocating indirect costs can be challenging, especially with shared resources.
- Variability: Cost per Ticket can fluctuate significantly depending on industry, company size, and the complexity of support requests.
- Limited Scope: May not capture the full value delivered by the help desk or its impact on business outcomes.
Examples of Successful Implementation:
- IBM reportedly reduced its cost per ticket from $45 to $28 by implementing AI-powered chatbots to handle first-tier support inquiries.
- Bank of America achieved a 30% cost reduction by transitioning password reset requests to self-service portals.
- Industry benchmarks from firms like Accenture show that the average enterprise help desk cost per ticket can range from $15 to $45, depending on industry and support complexity.
Actionable Tips:
- Implement tiered support: Route simpler issues to less experienced (and less costly) staff, reserving senior agents for complex problems.
- Invest in knowledge management: Empower agents with readily accessible information to reduce research time.
- Analyze costs by channel: Identify the most cost-effective support channels and optimize their usage.
- Consider total cost of ownership (TCO): Evaluate help desk tools based on their long-term costs, not just the initial purchase price.
- Balance cost reduction with customer satisfaction: Monitor customer feedback to ensure that cost-saving measures don't negatively impact the customer experience.
- Focus on reducing ticket volume: Implement proactive problem management and robust self-service options to prevent issues from arising in the first place.
Popularized By:
MetricNet, Gartner, HDI (Help Desk Institute)
By carefully tracking and analyzing Cost per Ticket, organizations can gain a deeper understanding of their help desk's financial performance and identify opportunities for improvement. Remember to balance cost efficiency with service quality to ensure a positive customer experience while optimizing your support operations.
7. Service Level Agreement (SLA) Compliance
Service Level Agreement (SLA) compliance is a crucial help desk metric that measures how effectively your team meets the promised service levels for resolving customer issues. It tracks the percentage of support tickets handled within the predefined timeframes outlined in your formal agreements with users or business units. Essentially, it's a contractual performance indicator that holds your help desk accountable for delivering on its service commitments. This makes it a vital metric for any organization striving to provide excellent customer service and operational efficiency, earning it a well-deserved spot on this list of essential help desk metrics.
SLA compliance is typically expressed as a percentage. For example, 90% SLA compliance means that 90 out of 100 tickets were resolved within the agreed-upon timeframes. These agreements often include tiered targets based on the priority or severity of the incident. A "critical" issue might have a response time SLA of 15 minutes, while a "low-priority" issue might have an SLA of 24 hours. Learn more about Service Level Agreement (SLA) Compliance to delve deeper into the specifics.
Features of SLA Compliance Tracking:
- Percentage-Based: Usually presented as the percentage of tickets meeting SLA targets.
- Tiered Structure: Often differentiated by incident priority or severity levels.
- Multiple Time-Based Targets: Includes targets for initial response, updates, and final resolution.
- Penalties: Can involve financial penalties for non-compliance.
- Formal Documentation: Should be clearly documented in agreements with customers/departments.
Pros of Monitoring SLA Compliance:
- Clear Expectations: Sets clear expectations for both the help desk and the end-users regarding service delivery.
- Accountability: Builds accountability into the support processes.
- Effective Prioritization: Helps prioritize tasks based on SLA urgency.
- Objective Measurement: Provides an objective measure of help desk performance.
- Business Alignment: Aligns IT support with overall business needs and expectations.
Cons of Focusing Solely on SLA Compliance:
- Gaming the System: Can incentivize agents to "game the system" to meet metrics, potentially sacrificing quality.
- Artificial Urgency: May create artificial urgency for lower-priority issues.
- Time-Centric Focus: Often focuses primarily on time rather than the quality of the resolution or overall value provided.
- Complexity: Can be complex to track and manage across different service types and agreements.
- Obsolescence: SLAs can become outdated if not regularly reviewed and adjusted.
Examples of Successful SLA Implementation:
- Salesforce guarantees 99.9% SLA compliance for Premier Support customers, offering financial credits for breaches. This demonstrates a strong commitment to service delivery and customer satisfaction.
- ServiceNow's internal IT help desk reportedly maintains 94% SLA compliance by leveraging automated escalation and alert systems. This highlights the power of automation in managing SLAs.
- HP Enterprise Services uses tiered SLAs with response times ranging from 15 minutes for critical issues to 24 hours for low-priority items. This illustrates the importance of differentiating SLAs based on impact and urgency.
Actionable Tips for Implementing and Managing SLAs:
- Realistic Targets: Set realistic and differentiated SLAs based on the actual impact and priority of different issue types.
- Real-Time Dashboards: Implement real-time SLA tracking dashboards that are visible to all help desk agents.
- Automated Alerts: Create automated alerts for tickets approaching or exceeding their SLA targets.
- Regular Review: Review and refine your SLAs periodically, based on performance data and changing business needs.
- Prioritization Processes: Ensure robust ticket prioritization processes are in place.
- Holistic Metrics: Include both operational metrics (like response time) and customer-focused metrics (like customer satisfaction) in your SLAs.
- Exception Handling: Document clear SLA exception processes for unusual circumstances or unforeseen events.
By understanding and effectively managing SLA compliance, you can significantly improve your help desk's performance, enhance customer satisfaction, and ensure that your IT support services are aligned with your organization's overall business objectives. It's a critical metric that provides valuable insights into the efficiency and effectiveness of your support operations.
Help Desk Metrics Comparison Overview
| Metric | Implementation Complexity 🔄 | Resource Requirements ⚡ | Expected Outcomes 📊 | Ideal Use Cases 💡 | Key Advantages ⭐ |
|---|---|---|---|---|---|
| First Contact Resolution (FCR) | Medium – requires training and knowledge management | Moderate – skilled agents & knowledge bases | Increased efficiency and customer satisfaction | Situations needing quick resolution and minimal follow-up | Strong help desk effectiveness, lower costs, better experience |
| Average Response Time | Low – automated tracking possible | Low to Moderate – staffing and monitoring | Faster acknowledgment, improved responsiveness | Environments where initial contact speed is critical | Easy to measure, improves accountability, identifies bottlenecks |
| Average Resolution Time | Medium – tracking end-to-end resolution | Moderate to High – requires coordination and escalation | Improved overall efficiency, user productivity | Complex issue resolution and productivity management | Comprehensive efficiency measure, bottleneck identification |
| Customer Satisfaction Score (CSAT) | Low – survey deployment and analysis | Low – survey tools and data collection | Direct user feedback on service quality | Measuring perceived service effectiveness | Direct feedback, highlights perception gaps, boosts morale |
| Ticket Volume and Categorization | Medium – taxonomy development and maintenance | Moderate – data analysis and categorization | Insight into demand patterns and systemic problems | Resource planning and proactive problem management | Identifies recurring issues, supports forecasting and training |
| Cost per Ticket | High – detailed cost tracking and allocation | High – financial and operational data needed | Financial visibility, cost optimization | Budgeting and cost management of support operations | Clear financial insight, supports investment justification |
| SLA Compliance | Medium – requires SLA definition and monitoring | Moderate – tracking and alerting systems | Accountability in meeting service commitments | Contractual service delivery and performance management | Clear expectations, objective measurement, prioritization |
Elevating Your Help Desk Performance with Screendesk and Key Metrics
Mastering help desk metrics is paramount to delivering exceptional customer support and driving business growth. Throughout this article, we've explored crucial metrics such as First Contact Resolution (FCR), Average Response Time, Average Resolution Time, Customer Satisfaction Score (CSAT), Ticket Volume and Categorization, Cost per Ticket, and Service Level Agreement (SLA) compliance. By regularly monitoring and analyzing these key performance indicators, you gain valuable insights into your help desk's strengths and weaknesses, enabling you to pinpoint areas ripe for improvement and optimize resource allocation.
The most important takeaway is that data-driven decisions lead to more efficient and effective support operations. By understanding which metrics to track and how to interpret them, you can identify bottlenecks, streamline processes, and empower your support team to deliver exceptional customer experiences. This translates to improved customer satisfaction, reduced operational costs, and ultimately, a stronger bottom line.
Ultimately, optimizing your help desk is about more than just resolving tickets; it's about building strong customer relationships and fostering loyalty. Ready to transform your help desk operations and unlock the full potential of your support team? Screendesk empowers support teams to improve key help desk metrics like FCR and Average Handling Time with powerful video tools. See how Screendesk can revolutionize your customer support by visiting Screendesk today and start your free trial.