
Elevate Your Customer Service with the Right KPIs
Want to deliver outstanding customer service and boost your bottom line? This listicle reveals 8 essential customer service performance indicators (CS KPIs) to track in 2025. Learn how metrics like Customer Satisfaction Score (CSAT), Net Promoter Score (NPS), First Contact Resolution (FCR), and more, provide the insights you need to improve service quality, understand customer needs, and gain a competitive edge. By monitoring these CS KPIs and using tools like Screendesk to enhance support interactions, you can drive customer satisfaction and business growth.
1. Customer Satisfaction Score (CSAT)
Customer Satisfaction Score (CSAT) is a key customer service performance indicator that measures how satisfied customers are with a specific interaction, product, or service. It provides a snapshot of customer sentiment immediately following an interaction, helping businesses understand how well they are meeting customer expectations in real-time. CSAT typically uses a numerical scale, such as 1-5 (where 1 is very dissatisfied and 5 is very satisfied) or 1-10, to gauge satisfaction levels. The score is calculated by dividing the number of satisfied responses (typically 4 and 5 on a 5-point scale) by the total number of responses, then multiplying by 100 to express it as a percentage.
CSAT deserves its place on this list because it's a fundamental metric for understanding customer happiness with individual interactions. Its simplicity and directness make it easy to implement and interpret, providing valuable insights into specific areas of strength and weakness. Features like customizable questions and segmentation capabilities allow businesses to tailor CSAT surveys to different customer segments, products, or services, providing granular data for targeted improvements. For example, a business might segment CSAT results by product line to identify which products are generating the highest levels of customer satisfaction and which need attention.
Pros of using CSAT:
- Easy for customers to complete: The simple rating scales minimize the effort required for customers to provide feedback, leading to higher response rates.
- Provides quantifiable data for tracking trends: CSAT scores allow businesses to track customer satisfaction over time and identify positive or negative trends.
- Identifies specific areas needing improvement: By tying CSAT surveys to specific transactions or interactions, businesses can pinpoint exactly where they are excelling and where they need to improve.
- High response rates when implemented properly: Short, focused surveys delivered immediately after an interaction tend to generate higher response rates than longer, delayed surveys.
- Allows for comparative analysis across departments: CSAT can be used to compare customer satisfaction levels across different departments or teams within an organization.
Cons of using CSAT:
- Only captures point-in-time sentiment: CSAT reflects customer satisfaction at a specific moment and may not reflect their overall feeling about the company or brand.
- Subject to response bias: Customers with extreme opinions (very satisfied or very dissatisfied) are more likely to respond to surveys, potentially skewing the results.
- May not reflect overall customer relationship: A single positive interaction doesn't guarantee long-term loyalty, and a single negative interaction doesn't necessarily mean a customer will churn.
- Cultural differences can affect scoring patterns: Interpreting numerical ratings can vary across cultures, making it important to consider cultural context.
- Doesn't necessarily predict future customer behavior: While CSAT can highlight areas for improvement, it doesn't directly predict future customer actions like repeat purchases or churn.
Examples of CSAT implementation:
- Amazon's post-purchase email surveys asking customers to rate their delivery experience.
- Zendesk's embedded CSAT surveys after support ticket resolution.
- Apple's service feedback requests after Genius Bar appointments.
- Airline satisfaction surveys after completed flights.
Tips for effective CSAT implementation:
- Keep surveys brief (1-3 questions): Shorter surveys are more likely to be completed.
- Ask for feedback immediately after the service interaction: This ensures the experience is fresh in the customer's mind.
- Use a consistent scale across all touchpoints: This allows for accurate comparison of scores across different channels.
- Include an open-ended question for qualitative feedback: This provides valuable context and insights beyond numerical ratings.
- Act on negative feedback quickly and close the loop with customers: This demonstrates that you value customer feedback and are committed to improving.
Popularized By: Salesforce, HubSpot, Qualtrics, American Customer Satisfaction Index (ACSI)
CSAT is a valuable tool for any business looking to improve customer service. By understanding its strengths and limitations, and by implementing it effectively, you can gain actionable insights into customer sentiment and drive improvements in your customer experience.
2. Net Promoter Score (NPS)
Net Promoter Score (NPS) is a crucial customer service performance indicator that gauges customer loyalty and their likelihood to recommend your company, product, or service. It's based on a simple question: "On a scale of 0 to 10, how likely are you to recommend [company/product/service] to a friend or colleague?" Customers responding with 9 or 10 are classified as "Promoters," representing your most enthusiastic and loyal customers. Those scoring 7 or 8 are "Passives," generally satisfied but not actively promoting your brand. Finally, those scoring 0 to 6 are "Detractors," indicating dissatisfaction and potential churn. Your NPS is calculated by subtracting the percentage of Detractors from the percentage of Promoters, resulting in a score ranging from -100 to +100.
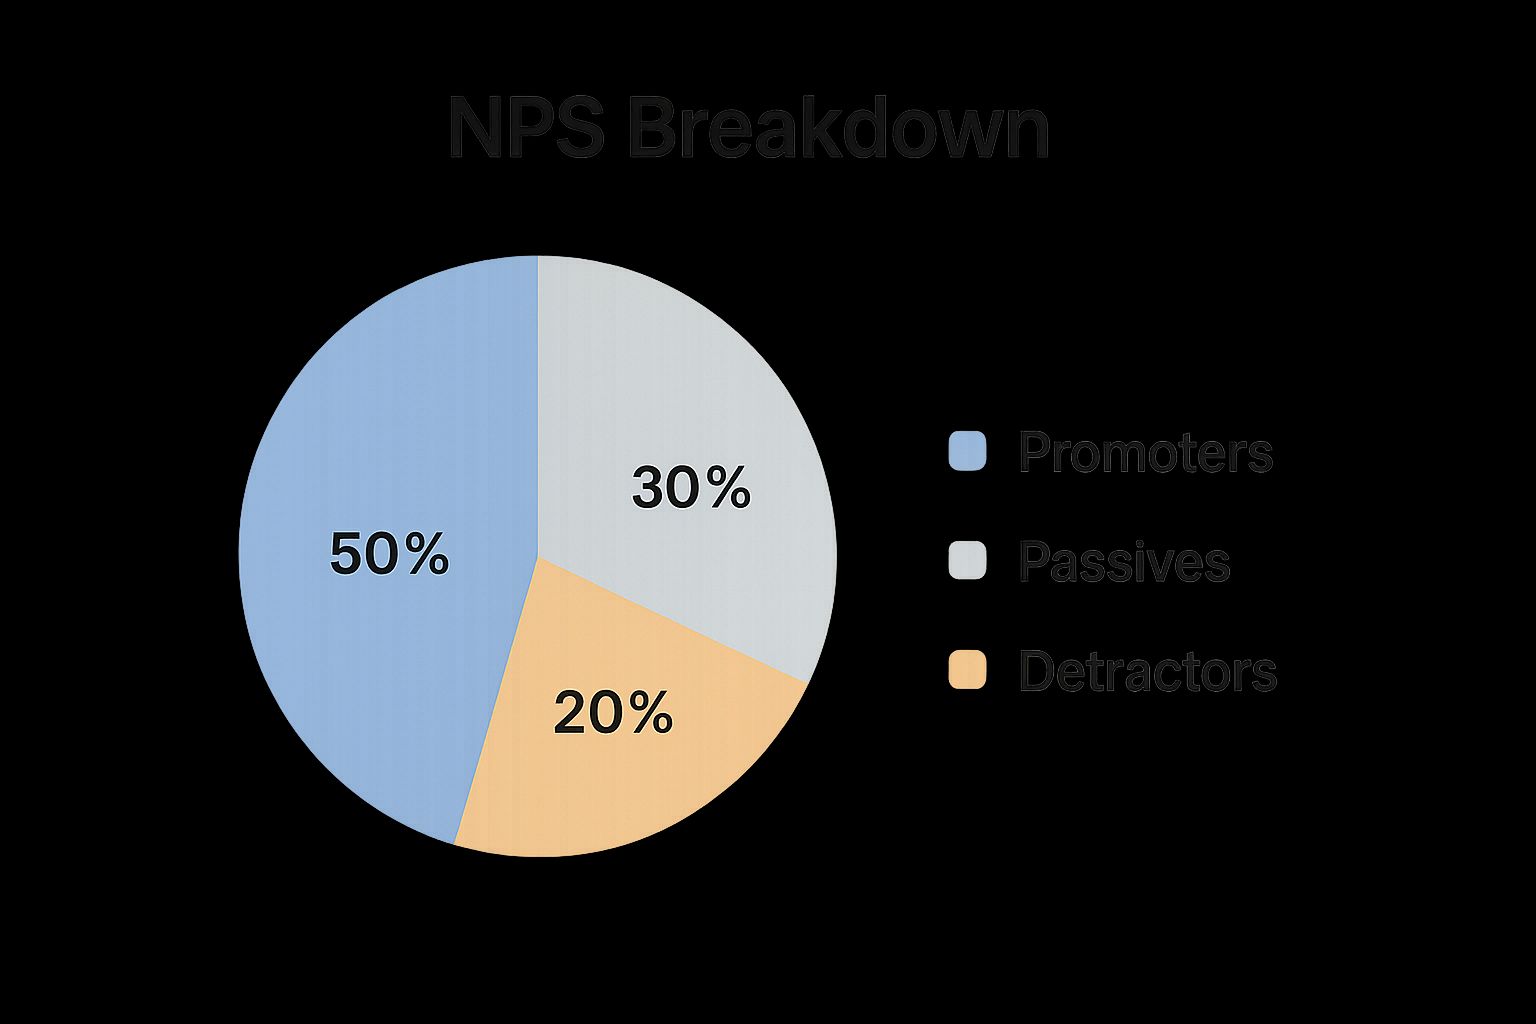
The infographic above visually represents the NPS calculation and categorization of customer responses. It emphasizes the importance of Promoters in driving growth and the negative impact of Detractors. Note how the visual clearly distinguishes the three categories and emphasizes the calculation method.
NPS deserves a place on this list of customer service performance indicators due to its simplicity, wide adoption, and correlation with business growth. Its single-question format makes it easy to implement and understand for both customers and businesses. This standardized methodology allows for benchmarking against competitors, providing valuable context for your score. Furthermore, NPS focuses on customer loyalty and advocacy, key drivers of customer retention and referrals.
Features:
- Single question simplicity
- Standardized methodology
- Focuses on customer loyalty and advocacy
- Provides both quantitative score and qualitative feedback (when combined with open-ended follow-up questions)
- Correlates with business growth metrics
Pros:
- Easy to implement and understand
- Widely adopted, allowing for benchmarking against competitors
- Predictive of customer retention and referrals
- Focuses organization on improving customer experience
- Can be measured across entire customer lifecycle
Cons:
- Oversimplifies complex customer relationships
- Doesn't explain why customers gave their rating (unless paired with follow-up questions)
- Cultural biases affect willingness to give top scores
- Single metric that doesn't identify specific improvement areas on its own
- Can be manipulated by selective surveying
Examples:
- Apple consistently achieves NPS scores above 70, highlighting its strong customer loyalty.
- Zappos tracks NPS as a core business metric, demonstrating its commitment to customer experience.
- Slack maintains a high NPS (>40) in the competitive SaaS space, indicating a strong user base.
- USAA has one of the highest NPS scores in financial services (>70), demonstrating the power of customer-centricity.
Tips for Effective NPS Implementation:
- Include follow-up questions: Understanding the "why" behind the score is crucial. Ask open-ended questions to gain valuable insights into customer sentiment.
- Survey at consistent intervals: Track changes over time to measure the impact of customer service initiatives.
- Segment NPS by customer segment, product line, or touchpoint: This helps pinpoint areas for improvement and tailor strategies.
- Close the loop with detractors: Reach out to dissatisfied customers to address their concerns and recover at-risk relationships.
- Share results across the organization: Create a customer-centric culture by making everyone aware of NPS and its importance.
When and Why to Use NPS:
NPS is a valuable tool for any organization looking to understand and improve customer loyalty. It's particularly useful for:
- Tracking customer satisfaction over time
- Benchmarking against competitors
- Identifying areas for improvement in the customer experience
- Measuring the impact of customer service initiatives
By consistently tracking and acting on NPS data, businesses can build stronger customer relationships, increase retention, and drive sustainable growth.
3. First Contact Resolution (FCR)
First Contact Resolution (FCR) is a key customer service performance indicator that measures the percentage of customer inquiries or issues resolved during the initial interaction, without the need for follow-ups, escalations, or transfers. A high FCR demonstrates efficiency and effectiveness in your customer service operations, directly impacting both customer satisfaction and your company's bottom line. By addressing customer needs promptly and completely the first time, you minimize customer effort and build trust. This metric is crucial for any business striving to provide excellent customer service and optimize their support processes.

FCR quantifies service efficiency by measuring both the speed and completeness of issue resolution. It can be tracked across various communication channels, including phone, email, chat, and social media, providing a holistic view of your customer service performance. Tracking FCR helps identify areas where agent training or knowledge base improvements are needed. A low FCR often highlights gaps in processes or resources that prevent agents from effectively resolving issues on the first contact.
Examples of Successful FCR Implementation:
- TD Bank: Has reported achieving over 80% FCR in their contact centers, signifying a strong focus on efficient and effective customer service.
- American Express: Prioritizes single-interaction resolutions, particularly for payment disputes, minimizing customer inconvenience and maximizing efficiency.
- Zappos: Empowers its customer service agents to resolve a wide range of issues without transfers, fostering a sense of ownership and accountability.
- Xfinity: Has improved its FCR by investing in enhanced diagnostic tools for agents, enabling them to quickly identify and resolve technical problems.
Tips for Improving FCR:
- Create comprehensive knowledge bases: Equip your agents with readily accessible information to quickly address common customer inquiries.
- Empower frontline staff: Give agents the authority to make decisions and resolve issues without requiring managerial approval.
- Implement skills-based routing: Direct inquiries to the most qualified agents based on their expertise, reducing the need for transfers and escalations.
- Use post-interaction surveys: Gather customer feedback to confirm resolution and identify areas for improvement from their perspective.
- Analyze root causes of repeat contacts: Understand the underlying reasons for recurring issues and implement process changes to prevent them.
Pros and Cons of Focusing on FCR:
Pros:
- Strongly correlated with customer satisfaction
- Reduces operational costs by minimizing repeat contacts
- Improves agent productivity and morale
- Indicates knowledge base and training effectiveness
- Prevents customer frustration
Cons:
- Can encourage quick but incomplete solutions
- Complex issues may legitimately require multiple contacts
- Difficult to measure consistently across channels
- May create pressure on agents to avoid necessary escalations
- Requires a clear definition of what constitutes 'resolution'
FCR deserves a prominent place in any list of customer service performance indicators due to its direct link to customer satisfaction and operational efficiency. By prioritizing FCR, businesses demonstrate a commitment to providing seamless and effective support experiences.
Learn more about First Contact Resolution (FCR)
This approach is particularly valuable for customer support teams, technical support managers, IT departments, customer experience professionals, and small business owners with online services. By understanding and actively working to improve FCR, these professionals can significantly enhance the quality of their customer service and drive business success. The concepts behind FCR have been popularized by organizations like the Service Quality Measurement (SQM) Group, ICMI (International Customer Management Institute), and Gartner, and influential figures like Jeff Bezos, highlighting its widespread importance in the business world.
4. Average Handle Time (AHT)
Average Handle Time (AHT) is a crucial customer service performance indicator that measures the average duration of a customer interaction. This includes the time spent talking to the customer, any hold time, and the work done after the interaction (also known as "after-call work" or "wrap-up time"). AHT provides valuable insights into operational efficiency, agent productivity, and ultimately, customer experience. It's a key metric for contact centers and any business focused on optimizing customer support. Its inclusion in any analysis of customer service performance indicators is essential due to its impact on both cost and customer satisfaction.
How AHT Works:
AHT is calculated by adding the total talk time, hold time, and after-call work, then dividing that sum by the total number of interactions handled. It can be measured across various communication channels, including phone calls, emails, chats, and social media interactions.
Why Use AHT?
AHT is a powerful metric because it directly impacts several key areas:
- Capacity Planning: Accurately forecasting staffing needs and resource allocation heavily relies on AHT. By understanding the average time spent per interaction, businesses can optimize staffing levels to meet customer demand.
- Cost Optimization: A lower AHT often translates to lower costs per contact, enabling businesses to improve their bottom line.
- Process Improvement: Analyzing AHT can reveal inefficiencies in workflows, systems, or agent training. This data-driven approach helps identify bottlenecks and areas for improvement.
- Agent Performance: While AHT shouldn't be the sole measure of agent performance, it can help identify areas where agents may need additional training or support.
Features and Benefits:
- Comprehensive Measurement: Encompasses all aspects of an interaction, from talk time to post-interaction processing.
- Multi-Channel Applicability: Measurable across different channels, providing a holistic view of customer service efficiency.
- Actionable Insights: Offers data-driven insights to improve processes, training, and resource allocation.
Pros:
- Clear Efficiency Metric: Provides a quantifiable measure of operational efficiency.
- Accurate Staffing Forecasts: Enables data-driven staffing decisions.
- Targeted Training: Helps pinpoint training needs for individual agents or on specific issues.
- Cost Reduction Potential: Optimizing AHT can lead to significant cost savings.
- Process Improvement: Highlights bottlenecks and areas for system improvements.
Cons:
- Potential for Negative Customer Impact: Overemphasis on reducing AHT can lead to rushed service and decreased customer satisfaction.
- Variability by Issue Type: Different issues naturally require different handling times.
- Pressure on Agents: Focusing solely on AHT can create undue pressure on agents.
- Limited Scope: Doesn't measure the quality or effectiveness of the resolution.
- Potential Conflict with First Contact Resolution: Pressure to reduce AHT might conflict with resolving issues on the first contact.
Examples of Successful Implementation:
- T-Mobile: Implemented AI-assisted agent tools to reduce AHT and improve customer experience.
- Intuit QuickBooks: Focuses on balancing AHT with customer satisfaction goals for a more holistic approach.
- Delta Airlines: Optimizes AHT while maintaining high service quality standards.
- Bank of America: Utilizes advanced call routing to connect customers with agents possessing the appropriate skill levels, thus optimizing AHT for various issue complexities.
Actionable Tips for Optimizing AHT:
- Segment by Issue Type: Analyze AHT by issue type for more meaningful insights.
- Optimize Processes and Systems: Streamline workflows and systems before focusing on individual agent performance.
- Use Efficient Scripts and Templates: Provide agents with resources to handle common scenarios quickly and effectively.
- Balance with Quality Metrics: Ensure AHT goals are balanced with customer satisfaction and first contact resolution rates.
- Analyze Outliers: Identify both problem areas and best practices by examining unusually high and low AHT instances.
Popularized By:
Organizations like COPC Inc., Genesys, Gartner, and McKinsey have all contributed to the popularization and understanding of AHT as a key customer service performance indicator. While they don't "own" the concept, their research and best practices have helped shape how businesses approach AHT optimization.
5. Customer Effort Score (CES)
Customer Effort Score (CES) is a crucial customer service performance indicator that measures how much effort a customer has to exert to get their issue resolved, a request handled, or a question answered. Unlike traditional satisfaction surveys, CES focuses on the ease of the experience. It directly addresses the friction customers encounter when interacting with your business. A high CES signifies an effortless experience, while a low score indicates areas ripe for improvement within your customer journey. This makes it a valuable tool for businesses looking to enhance customer loyalty and reduce churn.
CES typically uses a scale, often 1-5 or 1-7, asking customers how easy it was to interact with your company. For example, a question might be phrased as, "How easy was it to get your issue resolved today?" with 1 being "Very Difficult" and 7 being "Very Easy." Higher scores indicate less effort and a smoother experience. Research suggests that reducing customer effort is a stronger predictor of loyalty than simply aiming for customer delight or satisfaction – a key reason why CES deserves its place on this list of essential customer service performance indicators.
Features and Benefits of CES:
- Focus on Ease: CES hones in on the simplicity and efficiency of the customer journey, rather than just overall satisfaction.
- Scalable Measurement: The numerical scale (e.g., 1-7) provides quantifiable data for tracking progress and benchmarking. It can be applied to specific interactions (like a single support call) or the overall customer relationship.
- Predictive Power: CES is a strong predictor of customer loyalty and repurchase behavior. Reducing customer effort directly translates to increased retention.
- Actionable Insights: Unlike vague satisfaction metrics, CES allows you to pinpoint specific friction points in the customer journey, making it easier to implement targeted improvements.
- Promotes Simplicity: Focusing on CES encourages businesses to streamline processes and prioritize effortless experiences.
Pros:
- Direct Correlation with Loyalty: CES directly correlates with customer loyalty and retention.
- Friction Point Identification: It effectively identifies pain points and areas for improvement in the customer journey.
- Predictive of Behavior: CES is more predictive of future customer behavior than satisfaction alone.
- Actionable Improvements: The data collected provides clear direction for operational improvements.
- Encourages Streamlined Processes: Tracking CES promotes simplicity in process design.
Cons:
- Relatively New Metric: CES is newer than other metrics like CSAT or NPS, meaning there's less historical data available for benchmarking.
- Emotional Nuances: While crucial, CES may not fully capture the emotional aspects of the customer experience.
- Subjective Interpretation: The concept of "effort" can be interpreted differently across customers.
- Requires Follow-Up: Effectively using CES requires follow-up analysis to identify specific improvement areas.
- Limited Benchmarking: CES is not as widely benchmarked as more established metrics.
Examples of Successful Implementation:
- Amazon: One-click purchasing exemplifies minimizing transaction effort.
- USAA: Pre-filled forms drastically reduce the effort required for customers to provide information.
- Slack: The intuitive interface contributes to high CES scores.
- Progressive Insurance: Their mobile app simplifies the often complex claims process.
Actionable Tips for Using CES:
- Timely Measurement: Ask CES questions immediately after service interactions while the experience is fresh in the customer's mind.
- Qualitative Follow-up: Follow up quantitative CES scores with open-ended questions to gather qualitative data on specific friction points. For example, "What could we have done to make this experience easier for you?"
- Journey Mapping: Map the entire customer journey to identify high-effort touchpoints.
- Focus on Reduction: Concentrate improvements on reducing steps and simplifying processes, rather than adding new features that might increase complexity.
- Proactive Agent Training: Train customer service agents to anticipate customer needs and proactively prevent follow-up contacts.
When and Why to Use CES:
Use CES when you want to:
- Improve Customer Retention: Identifying and reducing friction points leads to increased customer loyalty.
- Streamline Processes: CES provides data-driven insights for optimizing customer journeys.
- Increase Efficiency: Reducing customer effort often translates to increased operational efficiency.
- Measure the Impact of Changes: Track CES over time to assess the effectiveness of implemented improvements.
By focusing on Customer Effort Score as a key customer service performance indicator, businesses can build stronger customer relationships, reduce churn, and ultimately drive growth.
6. Average Response Time
Average Response Time (ART) is a key customer service performance indicator that measures how long it takes for a customer to receive an initial response to their inquiry. This metric is tracked across all communication channels, including email, chat, phone, and social media. ART is crucial because response speed significantly influences customer satisfaction and reflects your organization's commitment to providing timely support. A slow response can lead to frustration and a negative perception of your brand, while a quick response can build trust and loyalty.

This metric deserves a place on any list of essential customer service performance indicators because it directly correlates with customer satisfaction. It’s a quantifiable measure that provides insights into the efficiency of your support operations. Features like channel-specific measurement and segmentation capabilities allow for a granular understanding of performance. You can track first response time versus ongoing response time, helping identify where bottlenecks occur in the customer journey. This data is also essential for meeting Service Level Agreements (SLAs).
Examples of Successful Implementation:
- Zappos: Known for their exceptional customer service, Zappos aims to answer 80% of calls within 20 seconds.
- JetBlue: Their social media team strives to respond to Twitter inquiries within 10 minutes.
- Buffer: Publicly shares their response time data as a demonstration of transparency and accountability.
- Nordstrom: Implements callback options to avoid long hold times, improving the customer experience.
Actionable Tips for Improvement:
- Set Channel-Specific Targets: Customer expectations differ depending on the channel. Aim for near-instantaneous responses on live chat, while a few hours might be acceptable for email.
- Prioritize Urgent Issues: Implement a queue prioritization system to address urgent customer issues first.
- Automated Acknowledgments: For channels with longer response times (like email), use automated acknowledgments to inform customers that their inquiry has been received.
- Staff According to Volume: Analyze historical volume patterns to ensure adequate staffing during peak hours and minimize wait times.
- Track Average and Maximum: Monitor both average and maximum response times. High maximums can indicate systemic issues or outliers that need attention.
Pros of Tracking Average Response Time:
- Direct Impact on Customer Perception: Faster responses translate to happier customers.
- Easy to Measure and Benchmark: ART is relatively straightforward to track and compare against industry standards.
- Improved Resource Allocation: Data on response times helps optimize workforce planning and resource allocation.
- Bottleneck Identification: Highlights inefficiencies in your service delivery process.
- Opportunities for Optimization: Provides data-driven insights to improve processes and implement technologies that enhance response times.
Cons of Overemphasizing Average Response Time:
- Potential Quality Sacrifice: Focusing solely on speed can compromise the quality of responses.
- Varying Channel Expectations: Different channels have dramatically different response time expectations.
- Peak Volume Challenges: Managing response times during peak periods requires flexible strategies.
- Varying Urgency Levels: Not all customers or issues require the same level of urgency.
- Doesn't Measure Resolution: ART only measures the initial response, not the effectiveness of the resolution.
Popularized By:
Industry leaders like Zendesk (benchmarking studies), ICMI (contact center standards), Salesforce Service Cloud (response time optimization), and Intercom (real-time support metrics) have championed the importance of Average Response Time as a crucial customer service performance indicator.
When and Why to Use This Approach:
Tracking ART is essential for any business that interacts with customers. It’s a valuable metric for understanding customer satisfaction, optimizing support processes, and improving overall service quality. Whether you're a small business owner or manage a large enterprise IT department, monitoring and improving your Average Response Time is crucial for delivering a positive customer experience.
7. Customer Retention Rate
Customer Retention Rate (CRR) is a crucial customer service performance indicator that measures the percentage of customers a company retains over a specific period. It's a key metric for understanding the long-term impact of your customer service efforts and its connection to your bottom line. In the broader context of customer service performance indicators, CRR acts as a lagging indicator, showing the cumulative effect of service interactions over time. Poor customer service experiences are a leading cause of customer churn, making CRR a valuable metric for evaluating the effectiveness of your support strategies.
CRR is calculated using the following formula:
((Number of Customers at End of Period – Number of New Customers Acquired During Period) / Number of Customers at Start of Period) * 100
For example, if you started with 100 customers, acquired 20 new customers, and ended the period with 110 customers, your CRR would be ((110 – 20) / 100) * 100 = 90%.
Why Customer Retention Rate Matters in Customer Service
CRR deserves its place on this list because it directly links customer service performance to financial outcomes. It's significantly more cost-effective (5-25x according to some studies) to retain existing customers than to acquire new ones. A high CRR indicates strong customer loyalty, which translates to increased revenue, lower marketing costs, and sustainable business growth. Moreover, retained customers are more likely to become brand advocates, further boosting your acquisition efforts through positive word-of-mouth.
Features and Benefits of Tracking CRR:
- Expressed as a percentage: Provides a clear and easily understandable measure of retention performance.
- Time-bound analysis: Allows for tracking trends and identifying periods of improvement or decline.
- Segmentation capability: CRR can be segmented by customer value tiers, product usage, or other relevant factors for deeper insights.
- Revenue correlation: Directly tied to revenue sustainability and profitability.
- Holistic business metric: Functions as both a customer service and overall business health indicator.
Pros:
- Directly connects service performance to financial outcomes.
- Provides a long-term perspective on service effectiveness.
- Easier and more cost-effective than customer acquisition.
- Helps identify at-risk customer segments.
- Highlights the long-term impact of service investments.
Cons:
- Lagging indicator, providing delayed feedback.
- Influenced by factors beyond customer service (e.g., product, price, competition).
- Requires longer measurement periods for meaningful data.
- Doesn't pinpoint specific service issues causing churn.
- Aggregate measurement can mask problems within specific customer segments.
Examples of Successful Implementation:
- Apple: Maintains 90%+ retention rates through its integrated support ecosystem, including AppleCare and in-store Genius Bars.
- USAA: Known for industry-leading customer retention driven by exceptional, personalized service.
- Amazon Prime: Boasts a 93% first-year renewal rate, supported by responsive customer service and a seamless shopping experience.
- Costco: Achieves a 90% membership renewal rate, bolstered by a liberal return policy and excellent in-store support.
Actionable Tips for Improving CRR:
- Segment retention rates by customer value and longevity to identify high-risk groups.
- Implement proactive at-risk customer identification programs based on engagement and service interactions.
- Conduct targeted retention outreach after service issues to address concerns and rebuild trust.
- Perform churn analysis to identify patterns and root causes of customer defection related to service failures.
- Create robust service recovery protocols, especially for high-value customers.
Learn more about Customer Retention Rate
Key Influencers and Thought Leaders:
The concept of customer retention and its impact on profitability has been popularized by experts like Frederick Reichheld (loyalty research), Harvard Business Review (cost of customer acquisition vs. retention studies), Salesforce (customer success methodology), and Gartner (customer experience impact on retention).
By diligently tracking and analyzing your Customer Retention Rate, and acting on the insights derived, you can significantly enhance customer loyalty, drive revenue growth, and build a sustainable business. CRR offers valuable context for other customer service performance indicators, helping you understand the long-term consequences of your customer service strategy.
8. Quality Assurance Score
Quality Assurance (QA) Score is a crucial customer service performance indicator that measures how well your team delivers service against pre-defined standards. It's a systematic process of monitoring and evaluating customer interactions to ensure consistent quality and identify areas for improvement. This makes it a key component for anyone looking to improve their understanding of customer service performance indicators. By focusing on aspects like accuracy of information, adherence to procedures, communication skills, and problem-solving effectiveness, QA scoring provides valuable insights into individual agent performance and the overall quality of your service delivery.
This multi-dimensional assessment goes beyond simple metrics like call duration. It delves into the quality of the interaction itself. You can customize the evaluation criteria based on your specific brand standards, incorporating both objective measurements (e.g., did the agent resolve the issue on the first call?) and subjective measurements (e.g., how empathetic was the agent?). For regulated industries, QA scores can also include compliance elements, ensuring adherence to specific legal and industry guidelines.
Examples of Successful Implementation:
- American Express uses conversation analytics and AI to automate parts of its QA scoring process, improving efficiency and scale.
- Discover Card has achieved impressively high QA scores (95%+) by investing in rigorous agent training programs.
- Southwest Airlines cleverly balances adherence to protocol with the importance of personality and genuine interaction in their evaluations.
- Zappos, known for its exceptional customer service, incorporates its core company values directly into its QA criteria.
Why Use QA Scoring?
QA scoring is invaluable for ensuring consistent service delivery across all agents, regardless of their experience level. It pinpoints specific training needs and skill gaps, allowing you to tailor coaching and development programs for maximum impact. By providing objective performance feedback, it helps agents understand their strengths and weaknesses, fostering continuous improvement. Learn more about Quality Assurance Score to deepen your understanding of how this process works.
Pros:
- Ensures consistent service delivery
- Identifies training needs and skill gaps
- Provides objective performance feedback
- Helps maintain regulatory compliance
- Can be linked to agent incentives and development plans
Cons:
- Can be labor-intensive to implement comprehensively
- Potential for evaluator bias or inconsistency
- May create tension between speed and quality metrics
- Can feel punitive if not balanced with positive feedback
- Difficult to standardize across different channels (e.g., phone, email, chat)
Actionable Tips for Implementing QA Scoring:
- Include both technical skills and soft skills (like empathy and active listening) in your evaluation criteria.
- Regularly calibrate between evaluators to ensure consistency and minimize bias. This is especially important with subjective measurements.
- Leverage call recording technology and AI-powered analysis tools to scale your monitoring efforts and gain deeper insights.
- Strive for a balance of negative and positive feedback in your scoring and coaching sessions. Focus on growth and improvement, not just shortcomings.
- Involve agents in the process! Including them in creating and refining evaluation criteria can increase buy-in and foster a culture of continuous improvement.
Key Players and Technologies:
Companies like NICE (QA technology provider), Verint (workforce optimization solutions), COPC Inc. (performance optimization standards), and the Call Center Industry Advisory Council (CIAC) have all played a significant role in popularizing and developing best practices for QA in customer service.
By implementing a well-designed QA program, you can elevate your customer service performance, boost agent morale, and ultimately drive customer loyalty and business growth. This metric deserves its place in any list of essential customer service performance indicators because it offers a deep dive into the quality of interactions, providing a rich source of actionable data for continuous improvement.
8 Key Customer Service Metrics Comparison
| Performance Indicator | Implementation Complexity 🔄 | Resource Requirements ⚡ | Expected Outcomes 📊 | Ideal Use Cases 💡 | Key Advantages ⭐ |
|---|---|---|---|---|---|
| Customer Satisfaction Score (CSAT) | Low: Simple to design & deploy | Low: Requires brief surveys | Immediate feedback on specific interactions | Measuring transaction-level satisfaction | Easy to understand, high response rates, trend tracking |
| Net Promoter Score (NPS) | Low: Single standardized question | Low: Minimal survey burden | Loyalty measurement and business growth correlation | Gauging overall customer loyalty and advocacy | Widely benchmarked; predictive of retention & referrals |
| First Contact Resolution (FCR) | Medium: Needs clear resolution definitions & tracking | Medium: Cross-channel measurement & training | Improved efficiency, fewer repeat contacts, higher satisfaction | Service efficiency and issue resolution assessment | Directly correlates with satisfaction; cost-saving |
| Average Handle Time (AHT) | Medium: Requires integrated call data tracking | Medium: Data systems plus agent process optimization | Operational efficiency insights and staffing forecasts | Contact center capacity planning & productivity | Clear operational metric; identifies bottlenecks |
| Customer Effort Score (CES) | Low: Simple question focused on effort | Low: Short surveys with focused analysis | Predicts loyalty by measuring ease of resolution | Reducing friction points in customer journeys | Actionable insights; strong loyalty predictor |
| Average Response Time | Medium: Channel-specific tracking needed | Medium: Requires monitoring tools per channel | Measures responsiveness; SLA compliance | Multi-channel support responsiveness | Direct impact on customer perception; easy benchmarking |
| Customer Retention Rate | High: Long-term data collection & segmentation | High: Data analysis and CRM integration | Measures long-term customer loyalty and churn risk | Evaluating overall service and business health | Connects service to financial outcomes; segmentable |
| Quality Assurance Score | High: Requires detailed evaluation frameworks | High: Quality monitoring systems and training | Ensures compliance & consistent service quality | Agent performance management and coaching | Objective feedback; identifies training needs |
Transform Your Customer Service with Data-Driven Decisions
This article explored eight crucial customer service performance indicators (CS KPIs): Customer Satisfaction Score (CSAT), Net Promoter Score (NPS), First Contact Resolution (FCR), Average Handle Time (AHT), Customer Effort Score (CES), Average Response Time, Customer Retention Rate, and Quality Assurance Score. Mastering these metrics provides a powerful toolkit for understanding your customer's experience and identifying areas for improvement. By analyzing these KPIs, you can pinpoint bottlenecks, optimize processes, and empower your support team to deliver exceptional service.
The key takeaway here is the importance of data-driven decision-making in customer service. Don't rely on gut feelings – use hard data to guide your strategy. Tracking these customer service performance indicators allows you to identify trends, measure the impact of changes, and ultimately create a customer-centric culture that fosters loyalty and drives business growth. Implementing the right tools can significantly improve your customer service performance. For example, leveraging live chat software can drastically improve your average response time and customer satisfaction.
Looking ahead, the ability to effectively leverage these insights will become even more critical in the increasingly competitive landscape. Remember, happy customers translate to a thriving business.
Want to take your customer service performance to the next level? Screendesk can help you visualize and analyze your key customer service performance indicators, empowering you to make data-driven decisions that improve customer satisfaction and boost your bottom line. Learn more about how Screendesk can revolutionize your customer service approach.